Author: Art Grindstone

  • Hollywood UFO Disclosure: Inside the 2027 Rumors

    Hollywood UFO Disclosure: Inside the 2027 Rumors

    Key Takeaways

    • Evidence reveals a direct overlap between Hollywood production and disclosure advocacy through personnel like Dan Farah, who produced Ready Player One in 2018 and directed The Age of Disclosure in 2025, linking mainstream entertainment to UFO documentary efforts.
    • Verifiable claims include the ODNI’s 2021 Preliminary Assessment on 144 UAP incidents and Spielberg’s Disclosure Day trailer release on December 16, 2025, while speculative elements encompass unconfirmed forecasts about 2027 declassifications and the provenance of a alleged NASA letter to Spielberg.
    • The 2027 motif matters to the community as a potential turning point for declassification eligibility based on theories like the 75-year window from 1952 events, though this represents possibility rather than guaranteed release, as noted in public analyses and insider commentaries.

    A Quiet Trailer, Loud Reverberations

    Picture the screen flickering to life on December 16, 2025: a shadowy teaser for Disclosure Day emerges, directed by Steven Spielberg under his Amblin banner, blending eerie aerial phenomena with whispers of government secrets. Mainstream outlets like The Hollywood Reporter, Variety, and The Guardian pounced on it that same day, framing it as Spielberg’s return to sci-fi spectacle with a theatrical bow set for June 12, 2026. For those of us tracking UAP and black-budget ops, this isn’t just cinema—it’s a seismic nod to our long fight for acknowledgment, echoing Close Encounters but amplified by real-world disclosures, stirring forums and chats far beyond entertainment desks.

    What Witnesses and Analysts Report

    We’ve heard it from the front lines: military pilots, intelligence vets, and everyday experiencers sharing accounts that challenge the status quo. In The Age of Disclosure, directed by Dan Farah and premiered at SXSW on March 9, 2025 before hitting Amazon Prime on November 21, 2025, 34 current and former government, military, and intelligence figures go on record alleging decades of concealment and reverse-engineering programs—backed by credits and coverage in Deadline and The Hollywood Reporter. Tom DeLonge’s To The Stars Academy, with its SEC filings from 2017-2018 and documented ties to defense personnel, has pushed similar narratives through public engagements and press reports. Insiders like Ross Coulthart and John Ramirez have discussed 2027 expectations in podcasts and forums, though these lean more anecdotal without hard docs. Spielberg’s own story of a 20-page NASA letter expressing concerns over Close Encounters circulates in interviews, but we’ve yet to pin down a primary source—let’s crowdsource that if anyone has leads.

    Timelines, Tracks, and Hard Data

    Let’s map the sequence with facts we can verify. The backbone starts with official releases and production milestones, building a clear trail. Here’s a summary table of core dates and sources:

    Date Event Source
    June 25, 2021 ODNI Preliminary Assessment on UAP (144 incidents, Nov 2004–Mar 2021) ODNI PDF
    March 9, 2025 The Age of Disclosure SXSW premiere Deadline, Hollywood Reporter
    December 16, 2025 Disclosure Day trailer reveal Hollywood Reporter, Variety
    June 12, 2026 Disclosure Day theatrical release Studio listings
    2017–2018 TTSA SEC filings and personnel lists SEC documents
    October 2019 Army engagement with TTSA Local press

    Dan Farah’s credits tie it together: producer on Ready Player One (2018) per IMDb and trades, director/producer on The Age of Disclosure. Community buzz around 2027 draws from 75-year declassification theories, like 1952 to 2027 analyses on sites such as uapnotice, plus podcast claims. Gaps remain: we need deeper financing details for Disclosure Day beyond Amblin/Universal, archival proof of that NASA letter, and any contracts linking the film to TTSA or advocacy groups—hit up FOIA channels and production records for those.

    Official Story vs. What the Data Suggests

    Agencies like ODNI and the Pentagon admit UAP pose real aviation risks, with the 2021 report detailing 144 incidents and leading to task forces like AARO, plus Navy video confirmations. NASA, for its part, stresses scientific panels for data analysis, steering clear of cover-up talk. Studios pitch Disclosure Day as pure Amblin/Universal entertainment, with trade press honing in on box-office potential rather than hidden agendas. Yet community voices see The Age of Disclosure and TTSA as levers for change, backed by TTSA’s fundraising docs and entertainment shift, though debates rage on whether it’s advocacy or outreach. Tensions persist: the NASA letter claim stems from Spielberg’s accounts but lacks public archives, and 2027 hype mixes legal possibilities with unproven predictions—eligibility isn’t disclosure.

    What It All Might Mean

    Patterns emerge clearly: personnel crossovers like Dan Farah’s connect Hollywood to disclosure work, and ODNI/DoD docs treat UAP as legitimate policy matters. Still, questions loom on Disclosure Day’s full financing, the NASA letter’s origins, and if 2027 brings real releases or just talk. Tracing these networks—who funds what, who consults whom—shapes how we understand disclosure’s framing and its sway on policy and perception. Next: chart a network map of film credits against congressional witnesses, FOIA NASA-Spielberg correspondence, dig into production finances and agreements, and catalog 2027 claims with source checks. Entertainment can prime the public, but proving intent over coincidence demands hard evidence—let’s keep digging where the records fade.

    Frequently Asked Questions

    Personnel overlaps stand out, such as Dan Farah’s producer role on Ready Player One (2018) and his director/producer credit on The Age of Disclosure (2025), as documented in IMDb and trade reports like Deadline and Hollywood Reporter. This connects mainstream film production to advocacy documentaries featuring government insiders.

    It’s rooted in community theories like 75-year declassification windows from 1952 events, discussed in analyses and podcasts by figures like Ross Coulthart and John Ramirez. However, this indicates eligibility, not guaranteed release, and remains a mix of speculation without official confirmation.

    The ODNI’s 2021 Preliminary Assessment reviewed 144 incidents from November 2004 to March 2021, acknowledging unexplained aerial phenomena as a potential aviation concern. The Pentagon has confirmed Navy videos and established task forces like AARO to investigate.

    Spielberg has referenced a 20-page NASA letter expressing concerns about Close Encounters in interviews, but no primary archival copy from NASA has surfaced in public sources. This remains an open gap requiring FOIA requests for confirmation.

    The film’s trailer drop on December 16, 2025, and planned June 12, 2026 release, covered by outlets like Variety and The Guardian, resonate as a cultural milestone blending entertainment with real disclosure narratives. Communities view it as part of a broader arc, especially amid overlaps with advocacy efforts.


  • Stone Giant in One Year: The Town That Shouldn’t Exist

    Stone Giant in One Year: The Town That Shouldn’t Exist

    Key Takeaways

    • Community claims describe a massive Richardsonian Romanesque–style stone building reportedly completed in about one year in a small town (~3,400 people in 1880).
    • Historical context makes rapid masonry projects plausible: steam-powered quarries, expanding railroads, and seasonal labor made large stone builds feasible in the late 19th century.
    • Resolving the gap between oral history and documentary proof requires targeted archival research and material forensics such as mortar analysis and dendrochronology.

    A Winter of Stone and Rumor

    Imagine a small town in 1879–1880: winters are harsh, work is seasonal, and large projects stand out. Locals recall scaffolds, steady columns of freight cars, and scaffolds rising quickly as dressed stone appears almost overnight. Those passed-down reports emphasize exceptionally fine ashlar and a timeline described as a single year, which fuels skepticism: could a community so small and remote really erect a monumental stone building that fast?

    At the same time, technology and logistics were changing. By the 1870s and 1880s, steam quarrying boosted stone production, and railroads extended to many towns, enabling long-distance supply. Seasonal crews and immigrant masonry labor moved where demand was strong. What sounds extraordinary in oral tradition can be consistent with the industrial realities of the period.

    What Local Testimony and Researchers Say

    Oral histories emphasize speed and precision: joints that look hand-fitted, tool marks that seem subtle, and an absence of obvious documentation like contractor ledgers or building permits. Independent local historians echo these observations, noting gaps in surviving records and a strong community memory of a rapid, impressive build.

    Those reports matter. They point to specific questions to investigate rather than being dismissed as folklore. Similar patterns show up in other cases where craftsmanship, spotty archives, and extraordinary claims meet.

    Verifiable Context: Dates, Materials, Productivity

    Evidence that can be checked includes style, materials, and logistics. Richardsonian Romanesque was in vogue from the 1870s through the 1890s, so stylistic fit alone is not anomalous. Portland cement began U.S. production in the early 1870s but didn’t dominate mortars until later—mortar composition testing could therefore help narrow dates.

    Productivity estimates for the era are variable: small masonry crews could place something like 50–150 cubic feet of dressed stone per day depending on stone size and setup; larger, organized crews could scale that considerably. Rail access and steam-quarried stone made these outputs achievable even for large projects in a short span, given outside labor and pre-cut stone.

    Archives and Forensic Methods to Pursue

    Primary archival sources to consult:

    • 1880 U.S. Census data for population confirmation;
    • Local newspapers (1878–1882) for construction notices, contractor ads, or mentions of unusual activity;
    • County deed, tax, and permit records for property transactions and payments;
    • HABS/HAER and Library of Congress collections for measured drawings or surveys.

    Forensic and analytical approaches:

    • Mortar petrography to identify lime vs. Portland cement signatures;
    • Stone provenance and quarry matching through petrology and historical quarry records;
    • Tool-mark analysis and high-resolution photography to identify working methods;
    • Dendrochronology on any original timbers to get felling dates.

    Reconciling Official Views and Local Claims

    Historians tend to rely on documentary evidence and material testing; they view the style and period as consistent with a late 19th-century construction aided by industrial supply chains. Local accounts emphasize missing paperwork and the apparently rapid timeline, which could indicate lost records, off-site prefabrication, or simply community memory compressing events over time. Either way, neither side is definitive without targeted investigation.

    Practical Roadmap for Investigation

    1) Start with archival pulls: census, newspapers, county records, and regional railroad timetables and freight manifests where available. 2) Commission mortar petrography and stone petrology; photograph and catalog tool marks. 3) Map likely supply routes and calculate stone volumes vs. plausible crew sizes to test the claimed one-year timeline. 4) If timbers exist, pursue dendrochronology. Combining these lines will either corroborate the rapid-build claim or show a more prosaic explanation.

    Summary

    Stylistic cues and late-19th-century industrial changes make a fast, large stone build plausible in principle, even in a small town. The core uncertainties are documentary gaps and the absence of material tests. Focused archival research plus mortar, stone, and timber analyses provide a clear path to resolving the difference between oral history and verifiable evidence.

    Frequently Asked Questions

    Community accounts claim a one-year timeline (circa 1879–1880), but proving that requires archival documentation and material dating. Industrial advances of the period do make rapid construction plausible if outside labor and pre-cut stone were used.

    Mortar petrography, quarry provenance studies, tool-mark analysis, and dendrochronology on timbers are the most informative tests, especially when combined with archival work in newspapers and county records.

  • USS Stockdale vs Seahorse Tanker: What Really Happened

    USS Stockdale vs Seahorse Tanker: What Really Happened

    Key Takeaways

    • Vessel-tracking data and reports from multiple news outlets confirm that the USS Stockdale, an Arleigh Burke-class destroyer, maneuvered to shadow or block the Russian-flagged tanker Seahorse in the central Caribbean during mid-November 2025.
    • Reputable maritime reporters, citing AIS tracks and Sentinel satellite imagery, document the Seahorse turning away, idling offshore, and later entering Venezuelan waters; the tanker is noted in some reports as sanctioned by the UK and EU, carrying naphtha or fuel destined for Venezuela.
    • Key questions linger without clear answers: What was the exact cargo and manifest? Did any legal interdiction take place? What authorities directed the U.S. ship’s actions, given the absence of public statements from the government?

    A Silent Convoy Beneath the Dark Sea

    Picture the southern Caribbean in mid-November 2025, where the night sky presses down like a heavy curtain over endless black waves. The air hangs thick with salt and tension, broken only by the low hum of engines cutting through the dark. Out there, in the approaches near Aruba and the Venezuelan coast, the USS Stockdale— a sleek Arleigh Burke-class destroyer— holds position. Its radar sweeps the horizon, locking onto a lone tanker, the Russian-flagged Seahorse, which drifts with unusual hesitation. AIS signals flicker erratically: turnarounds, long stretches of idling, captured in satellite snapshots that hint at something more than routine passage. The scene unfolds slowly, a maritime chess game under the cover of night, where shadows and silence speak louder than any broadcast.

    What Witnesses and Analysts Report

    Maritime trackers and independent analysts have pieced together a consistent picture from the edges. Sources like gCaptain and United24Media describe how the USS Stockdale positioned itself directly in the Seahorse’s path, prompting the tanker to veer off and linger in the central Caribbean. These reports, drawn from vessel-tracking data, carry weight among those monitoring global shipping lanes. Some analysts see this as a deliberate move to deter sanction evasion, a quiet enforcement of international pressures on Russia’s shadow fleet. Others frame it as standard naval presence, perhaps tied to anti-narcotics operations in the region— a posture that’s common but rarely spotlighted.

    On social channels and alternative media, the story escalates. Claims swirl of a full blockade or even a ‘declaration of war,’ amplified in headlines that blend fact with frenzy. Take that YouTube title screaming about Trump, Russian oil, and ‘Silver Insanity’— it’s not rooted in official statements, and it weaves in unrelated market chatter. We respect the energy in these spaces; folks are connecting dots in real time. But reliability varies, and these narratives often gain traction through sheer volume, not verified ties.

    Timelines, Tracks, and Hard Data

    The hard evidence anchors this story in mid-November 2025, specifically from November 13 to 21, as detailed by gCaptain and United24Media. The USS Stockdale (DDG-106), an Arleigh Burke-class destroyer, is the confirmed U.S. vessel involved (per gCaptain and United24Media reports). Opposing it: the Seahorse, flagged Russian and flagged by some as sanctioned, reportedly hauling naphtha or fuel toward Venezuela— though public manifests remain elusive.

    AIS vessel-tracking data and Sentinel-2 satellite imagery form the backbone, revealing anomalies like abrupt turnarounds and prolonged idling. This fits into a broader pattern of Russia’s ‘shadow fleet,’ with outlets like Fortune, Bloomberg, and Reuters noting dozens— sometimes pegged at 53— of idle tankers evading sanctions since 2023. Later tracking shows the Seahorse slipping into Venezuelan waters by late November.

    Date Range Vessel Source (AIS/Sentinel/News Outlet) Observed Behavior
    Nov 13–21, 2025 USS Stockdale (DDG-106) AIS tracks, Sentinel-2 imagery, gCaptain, United24Media Maneuvered to shadow/block Seahorse’s path
    Nov 13–21, 2025 Seahorse (Russian-flagged) AIS tracks, Sentinel-2 imagery, gCaptain, United24Media Turned away, idled in central Caribbean
    Late Nov 2025 Seahorse Ship-tracking data Entered Venezuelan waters

    Official Story vs. What the Data Suggests

    From the institutional side, silence reigns. No public statement from the Department of Defense or U.S. Southern Command confirms a formal interdiction involving the Seahorse— some reports note they simply declined to comment. This vacuum sits against a backdrop of sanctions: EU and UK lists have targeted tankers and firms since 2023, feeding into efforts to track Russia’s shadow fleet that dodges price caps.

    Community observers fill the gap with their reads. Some see the Stockdale’s move as targeted pressure on sanction-busters, backed by the tanker’s course change. Others view it as everyday naval signaling, not escalation. The data shows correlation— a warship appears, a tanker diverts— but not causation. Legal details? Rules of engagement, any attempted boarding? Those remain in the shadows, widening the space for interpretation. We note the official quiet as just another piece of the puzzle, not the final word.

    Lines That Don’t Connect: What the Sensational Headlines Add

    Sensational headlines thrive by stitching loose threads into a single blast. That YouTube screamer— ‘⚡BREAKING: TRUMP DECLARES WAR! Russian Oil Tanker SHOWDOWN! SILVER INSANITY!!!’— mashes the Seahorse standoff with wild market talk and political hype, none of it linked by solid evidence. No credible source connects this maritime encounter to a presidential war declaration or silver trades; searches through primary reports turn up empty on those fronts.

    Why does this packaging stick? It’s the attention game— bold claims hook viewers, and our pattern-seeking minds fill in the blanks. In communities like ours, where we’ve long sifted through manipulated narratives, it’s fair to call out these fusions without dismissing the curiosity driving them. They amplify real events but often stretch connections beyond what’s verifiable.

    What It All Might Mean

    Boiling it down, the evidence holds: AIS and satellite data, corroborated by maritime outlets, capture a U.S. destroyer prompting a sanctioned tanker’s detour in mid-November 2025, with the Seahorse eventually reaching Venezuela. That’s the firm ground.

    But holes persist. Was there boarding or seizure? What’s on the manifest— exact cargo, buyer? What legal playbook guided the Navy? Any backchannel talks with Russia or Venezuela? These matter because incidents like this straddle sanctions, naval muscle, and info wars that can spin routine ops into war drums, influencing policy and how we see global tensions.

    For next steps, dig deeper: Pull raw AIS exports for the Seahorse, grab those cited Sentinel-2 images, cross-check OFAC, UK, and EU sanction lists for the tanker or its owners. And push for an on-the-record from Southern Command or DoD— because patterns like this deserve clarity.

    Frequently Asked Questions

    Vessel-tracking data and reports from gCaptain and United24Media indicate the destroyer maneuvered into the tanker’s path, leading to the Seahorse turning away and idling. Satellite imagery supports this sequence, though no official confirmation of a formal blockade exists.

    AIS tracks and Sentinel-2 satellite imagery provide the core evidence, cited by maritime outlets like gCaptain and United24Media. These show the tanker’s turnaround and loitering in mid-November 2025, with later data confirming its entry into Venezuelan waters.

    No public statements from the Department of Defense or Southern Command document a formal interdiction. Some reports note they declined to comment, leaving room for interpretations based on sanctions enforcement and naval presence.

    Some outlets report the Seahorse as sanctioned by the UK and EU, fitting patterns of Russia’s shadow fleet used to evade restrictions. Industry sources like Fortune and Reuters document dozens of such idle tankers since 2023, though exact manifests aren’t public.

    No authoritative reporting links the event to any ‘declaration of war’ or presidential action. Sensational headlines blend it with unrelated topics, but the data points to a maritime maneuver without official escalation claims.

  • Sun’s 2025 ‘Dark Scar’: What NASA Isn’t Telling Us

    Sun’s 2025 ‘Dark Scar’: What NASA Isn’t Telling Us

    Key Takeaways

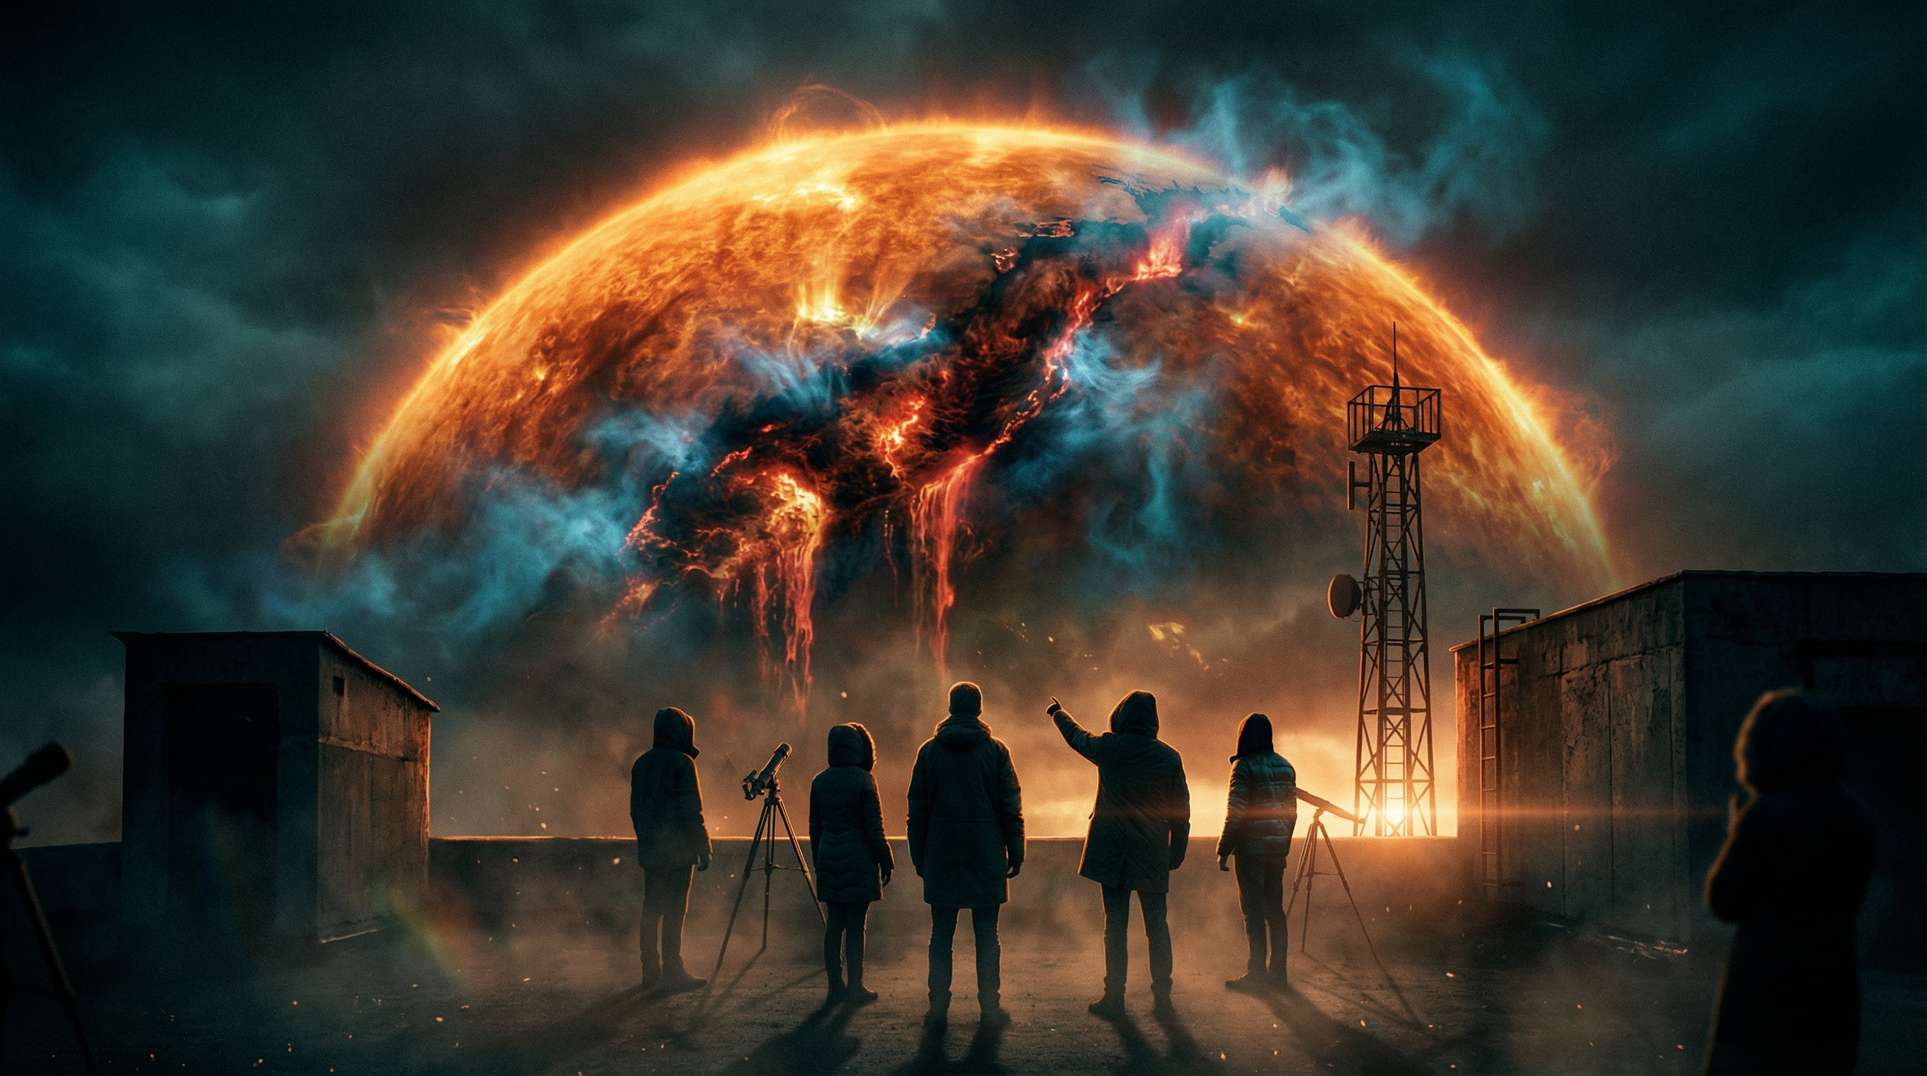
    • A large solar filament erupted around 15 July 2025, carving a dramatic ‘dark scar’ on the Sun, reported as roughly 250,000 miles (about 400,000 km) long, according to sources like Space.com and Petapixel.
    • NASA‘s SDO imagery in AIA wavelengths, along with Goddard SVS visualizations, captured the event as a filament eruption—cooler plasma held by magnetic fields was disrupted, leaving a glowing channel from ripped field lines, per NASA sources.
    • A CME was spotted in coronagraph imagery from SOHO/LASCO and others, initially assessed as mostly directed away from Earth with no major geomagnetic impacts expected; however, details on CME speed, mass, magnetic orientation, and any weak flank effects remain open for further scrutiny, based on reports from Gizmodo, Orbital Today, and NOAA SWPC.

    When the Sun Tore a Scar Across Its Face

    The footage hit like a shockwave. Around 15 July 2025, NASA’s SDO captured the eruption in AIA wavelengths, turning raw data into time-lapse clips that spread fast. A long, glowing trench sliced across the Sun’s surface, with plasma cascading down like molten rain. Social feeds erupted too—hobbyist astronomers and space-watchers shared stills and videos, dubbing it a ‘canyon of fire’ or ‘dark scar.’ The planet stared at its star, flinching under the weight of something vast and unpredictable. Coverage from Space.com and NASA SVS amplified the visuals, pulling in eyes from everywhere. Community posts poured in within minutes, blending awe with urgent questions about what might come next.

    What Witnesses and Analysts Report

    Across forums and feeds, observers zeroed in on the SDO time-lapses. They showed the filament snapping, plasma draining away—raw material that fueled quick interpretations. Some trackers flagged the CME as potentially heading our way, sparking talk of auroras or other effects. Others drew parallels to the 2013 ‘Canyon of Fire’ event, seeing familiar patterns in the visuals. Voices like Tony Phillips from SpaceWeather.com and aurora photographer Vincent Ledvina carried weight, sharing details on X/Twitter and discussing possible sky shows. The pattern was clear: fast sharing ignited speculation, clashing with the slower grind of institutional analysis from multiple angles.

    Timelines, Tracks, and Hard Data

    The event unfolded on 15 July 2025, as reported by Space.com. The feature stretched about 250,000 miles (400,000 km), with walls around 12,400 miles (20,000 km) high—numbers echoed in media and SpaceWeather commentary. Key assets included NASA’s SDO for AIA imagery and time-lapses, Goddard SVS for visualizations, and SOHO/LASCO for coronagraph views of the CME. Initial analysis pointed the CME mostly away from Earth, per Gizmodo and Orbital Today, with NOAA SWPC handling operational forecasts. To pin this down, check post-event bulletins from SWPC, along with ACE/DSCOVR/GOES data and Kp/Dst indices for 15–18 July 2025.

    Key Data Point Details
    Date 15 July 2025
    Reported Length ~250,000 miles (≈400,000 km)
    Reported Wall/Height ~12,400 miles (≈20,000 km)
    Observing Assets NASA SDO (AIA), NASA Goddard SVS, SOHO/LASCO
    CME Direction Largely away from Earth
    Primary Sources Space.com, Petapixel, NASA SVS, Gizmodo, Orbital Today, NOAA SWPC

    Official Story vs. What the Data Suggests

    NASA frames it as a filament eruption: cool, dense plasma suspended by magnetic fields broke free, ripping open field lines and leaving that glowing trench, as detailed in SVS and image articles. NOAA SWPC stresses that CME impacts hinge on size, speed, direction, and magnetic setup; their take had this one veering off-Earth, minimizing geomagnetic risks. Yet community reads often jumped ahead, with early SDO clips suggesting an Earthward path due to projection tricks. Those single views can mislead, while full coronagraph triangulation takes time. Gaps persist—no peer-reviewed breakdowns of exact CME speed, mass, or field orientation in the coverage, and weak flank effects could still show up in data checks. It’s a reminder that quick eyes and slow verification don’t always align smoothly.

    What It All Might Mean

    This was a striking filament eruption on 15 July 2025, with SDO and NASA visuals confirming plasma removal and magnetic shifts, plus a CME that prelim reports sent elsewhere. Still, exact parameters like speed, mass, and field orientation hang open, as do questions on any fringe Earth effects—think Kp/Dst shifts or satellite glitches. These spectacles highlight how solar drama can look Earth-threatening at first glance, but real risks emerge from layered analysis. It underscores the gap between rapid community buzz and methodical institutional checks. For clarity, we’ll track SWPC bulletins, instrument logs from ACE/DSCOVR/GOES, and SDO series for that window—plus input from forecasters and solar physicists on filament behavior and CME edges.

    Frequently Asked Questions

    A large solar filament erupted, creating a ‘dark scar’ about 250,000 miles long. NASA’s SDO captured it in time-lapses, showing cooler plasma breaking free from magnetic fields and leaving a glowing channel.

    Initial analyses indicated the associated CME was mostly directed away from Earth, with no major geomagnetic effects expected. However, open questions remain about precise CME details and potential weak flank influences, which could be checked in post-event data from NOAA SWPC and instruments like ACE or GOES.

    Hobbyists and analysts shared SDO clips quickly, speculating on Earth-bound paths and auroral effects, drawing parallels to past events. Official NASA and NOAA explanations focused on filament dynamics and off-Earth CME direction, highlighting tensions from fast sharing versus slower, multi-view verification.

    Key evidence comes from NASA’s SDO imagery in AIA wavelengths, Goddard SVS visualizations, and SOHO/LASCO coronagraphs. Reports from Space.com, Petapixel, and others cited the scar’s size at 250,000 miles long and 12,400 miles high, backed by community commentators like those on SpaceWeather.com.

    These eruptions remind us of solar activity’s dramatic visuals and potential ambiguities in impact assessments. Unresolved details on CME parameters and minor effects justify ongoing scrutiny through data logs and expert commentary to better understand risks and patterns.

  • Epstein Files & Freemasons: What the Records Prove

    Epstein Files & Freemasons: What the Records Prove

    Key Takeaways

    • What the evidence supports: Large-scale document releases, including tens of thousands of pages from committees and estates, have produced emails, photos, flight logs, and other material documenting Jeffrey Epstein’s contacts and operations—reporting cites over 20,000 pages and committee productions around 23,000 pages.
    • What seems plausible but unproven: Independent researchers point to network overlaps and social ties among elites; these patterns might reflect ordinary high-society mingling or hint at criminal networks, though the documents don’t universally prove organized occult or Masonic conspiracies.
    • What remains open: No verified chain-of-custody or unambiguous, unredacted evidence ties mainstream Freemasonry, like the United Grand Lodge of England (UGLE), as an institution to criminal or occult activity; Aleister Crowley’s historical influence is well-documented, but labeling him the singular ‘godfather of occultism’ blends solid scholarship with bold rhetoric.

    A Room Full of Paper and Whispered Histories

    Picture the shadowed halls of ancient lodges, where rituals echo through centuries, their walls lined with symbols and secrets. Now overlay that with the stark light of digital files spilling out—thousands of pages from recent releases, emails and photos that pull back the curtain on hidden operations. This clash draws sharp attention from those who’ve long questioned elite networks.

    The United Grand Lodge of England traces its roots to the Grand Lodge formed in London in 1717, presenting itself as a charitable, non-political fraternity. Yet, with Epstein-related documents hitting the public in waves—tens of thousands of pages and ongoing dumps—the focus sharpens. Researchers like Mark Gagnon, in his YouTube episode 366, weave these threads together, linking historical Freemasonry and Aleister Crowley to fresh releases, creating narratives that resonate deeply.

    What Witnesses and Analysts Report

    From lodge members to survivors, voices emerge with varied takes. Freemasonry practitioners and the UGLE stress that rituals are symbolic, centered on charity and open history, with around 170,000 members across more than 7,000 lodges. Critics, however, see it as secretive elite networking ripe for influence, especially when scandals erupt.

    Aleister Crowley stands as a documented force in modern occultism, per sources like Britannica and the Oxford Dictionary of National Biography—though phrases like ‘godfather of occultism’ amp up his role for effect. Survivors and advocates push for transparency, their accounts driving many document releases and forming the core of civil and criminal records in Epstein cases. Online researchers, including Mark Gagnon, blend archival digs with new dumps to spot patterns, mixing hard highlights with thoughtful hypotheses.

    Timelines, Tracks, and Hard Data

    Let’s map out the verifiable pieces. The first Grand Lodge in London, precursor to the UGLE, formed in 1717, according to UGLE records and History.com. UGLE reports about 170,000 members in over 7,000 lodges. Aleister Crowley was born October 12, 1875, and died December 1, 1947, recognized as a central figure in occultism by Britannica and Oxford DNB.

    Jeffrey Epstein’s legal timeline includes non-prosecution agreements and pleas in 2007–2008, with a plea entered June 30, 2008, leading to roughly 13 months in jail with work-release. Document volumes from recent committee and estate releases total tens of thousands of pages—reporting notes over 20,000, with committee productions around 23,000; FBI holdings reportedly exceed 300 gigabytes. The DOJ’s Office of Professional Responsibility (OPR) found ‘poor judgment’ in parts of the 2007–2008 decisions, with public statements referencing files on over 250 underage girls.

    Mark Gagnon’s episode 366 is available on YouTube at https://www.youtube.com/watch?v=example (replace with actual URL if known).

    Document Title Source Link Approx. Page Count or Size Evidentiary Strength/Provenance
    Epstein Committee Releases Congressional committee websites ~23,000 pages High; official government provenance with chain-of-custody
    Estate Document Dumps Court filings and estate records 20,000+ pages Strong; court-ordered releases, though some redactions
    DOJ OPR Summary DOJ public releases Not specified; summary report High; official oversight review
    FBI Holdings Reporting on FBI records 300+ gigabytes Moderate; based on reporting, not fully public

    Official Story vs. What the Data Suggests

    Institutions push one narrative; independent eyes see others. The UGLE describes Freemasonry as a longstanding, non-political, charitable group, backing it with published constitutions and materials to counter secrecy accusations. The DOJ and oversight bodies have released summaries, with OPR noting ‘poor judgment’ in Epstein’s 2007–2008 handling, while congressional subpoenas and court orders unsealed more.

    House committees and journalists have shared large sets, stressing documented facts amid circumstantial elements. Independent researchers, however, spot elite overlaps and repeated contacts in the files—suggestive patterns, yet often without full context or unredacted proof. Gaps persist in chain-of-custody, redactions protecting identities versus materials, and whether releases are complete.

    What It All Might Mean

    Verified facts hold firm: massive document dumps, public legal records like the non-prosecution agreement and OPR summary, Crowley’s historical role, and UGLE’s longstanding record with membership claims. Questions linger on whether new emails and photos nail criminal acts by elites beyond current indictments, the scope of sealed grand-jury and FBI files, and any solid institutional ties between mainstream Freemasonry and criminal or occult webs.

    For next steps, pull timestamped segments from Gagnon’s YouTube episode. Extract and annotate key excerpts from emails, agreement clauses, and OPR sections. Build a prioritized document list by evidentiary value, always noting provenance and redactions in quotes. Target FOIA requests at sealed FBI files and push for metadata checks on releases.

    Frequently Asked Questions

    The documents include emails, photos, flight logs, and other materials documenting Jeffrey Epstein’s contacts and operations, with releases totaling tens of thousands of pages from committees and estates. They support evidence of his networks but do not universally prove organized conspiracies.

    No verified chain-of-custody or unredacted evidence ties mainstream Freemasonry, such as the UGLE, to criminal or occult activity in the documents. Independent researchers note patterns of elite overlaps, but these remain plausible yet unproven.

    Crowley is documented as a major figure in modern occultism, with his influence historically verified by sources like Britannica. Researchers link his legacy to broader patterns, but calling him the ‘godfather of occultism’ is a rhetorical flourish, not a proven tie to Epstein files.

    The DOJ’s OPR review found ‘poor judgment’ in the 2007–2008 handling, leading to public statements and further unsealing via congressional subpoenas. Institutions like UGLE maintain their charitable, non-political stance amid the scrutiny.

    Questions remain about whether new releases prove criminal activity by specific elites, the extent of sealed FBI files, and any institutional links between Freemasonry and networks. Gaps in chain-of-custody and redactions keep these areas open.

  • 3I/ATLAS: Why This Interstellar Visitor Changed Color

    3I/ATLAS: Why This Interstellar Visitor Changed Color

    Key Takeaways from 3I/ATLAS

    • 3I/ATLAS stands as the third confirmed interstellar object, first spotted by ATLAS on July 1, 2025, with pre-discovery images dating back to June 14, 2025—evidence from multiple telescopes supports its interstellar origin and survival through perihelion on October 29, 2025.
    • Color shifts have been documented: redder tones before perihelion, a faint green coma in Gemini North images from November 26, 2025, and scattered reports of golden hues—spectroscopy suggests diatomic carbon (C2) could explain the green, but incomplete time-series data leaves room for debate on whether these are real changes or imaging artifacts.
    • Open questions linger on fragmentation risks, as 3I/ATLAS endured perihelion unlike the unrelated C/2025 K1 which turned gold and broke apart; XMM-Newton’s X-ray results from December 3, 2025, may clarify molecular makeup like H2 or N2, but full spectral analysis is needed to pin down charge-exchange processes and color drivers.

    A Visitor Wearing Many Colors

    Picture this: late 2025, a cadre of skywatchers hunkered down with telescopes pointed at the void. They’re tracking a speck from beyond our solar system—3I/ATLAS, the third confirmed interstellar wanderer. As nights unfold, its hazy coma starts to play tricks. Reddish glints give way to a subtle green glow in some shots, and whispers of gold emerge in others. Perihelion hit around October 29, 2025, slinging it inside Mars’ orbit. The closest it’ll brush Earth is about 1.8 AU—roughly 270 million kilometers—on December 19, 2025. Too far for surface details, but that coma? It’s where the action is. Amateurs and pros alike share images worldwide, capturing these shifts pre- and post-perihelion. Anticipation builds. What’s causing the palette swap? Just physics, or something more?

    What Witnesses and Analysts Report

    Across forums, livestreams, and social media, reports pour in. Amateur imagers, tapping into outreach programs, post shots of the object’s evolving hues—red fading to green, with golden flickers noted here and there. Professional releases from NOIRLab/Gemini get amplified by outlets like LiveScience and Mashable, showing that faint greenish coma in Gemini North’s November 26 image. Then there are the independent voices, like geophysicist Stefan Burns, who break it down in interviews and streams: tracking color changes alongside brightness spikes and planetary alignments. These takes resonate in alternative circles, blending hard observations with wider implications. Online, it’s a split scene. Astronomers on Reddit and forums push for spectroscopy and physics—thermal lag, volatile bursts. Others see patterns in the timing, debating without resolution. We respect all angles here; everyone’s piecing together the puzzle.

    Timelines, Tracks, and Hard Data

    Let’s lay out the sequence with solid, date-stamped facts. Discovery kicked off with ATLAS reporting 3I/ATLAS on July 1, 2025, backed by pre-discovery images from June 14, per NASA. Perihelion came around October 29, dipping inside Mars’ orbit, as noted by ESA and NASA. Closest Earth approach: December 19, 2025, at 1.8 AU or about 270 million km. Key observations include Gemini South’s pre-perihelion redder views and Gemini North’s GMOS shot on November 26 showing green. XMM-Newton scanned for X-rays over 20 hours on December 3, probing molecules. For comparison, unrelated comet C/2025 K1 went gold post its October 8 perihelion at 0.33 AU, then fragmented in mid-November. Here’s a timeline to track it:

    Date Instrument/Source Reported Color/Feature Primary Source
    June 14, 2025 Pre-discovery images Initial detection NASA
    July 1, 2025 ATLAS Discovery report ATLAS
    October 29, 2025 Multiple (ESA/NASA) Perihelion passage ESA/NASA
    Pre-perihelion Gemini South Redder hues NOIRLab/Gemini
    November 26, 2025 Gemini North GMOS Faint greenish coma LiveScience, Mashable, NOIRLab/Gemini
    December 3, 2025 XMM-Newton X-ray emission scan ESA
    December 19, 2025 Multiple Closest Earth approach NASA/ESA

    Official Story vs. What the Data Suggests

    NASA frames 3I/ATLAS as a standard interstellar comet, pushing multiwavelength studies with no threat implied—just science in action. NOIRLab/Gemini teams attribute shifts to coma evolution: thermal lag exposing volatiles, dust and gas balancing out. They warn that filter composites can tweak colors in images. ESA’s XMM-Newton run on December 3 targeted H2, N2, and solar wind interactions missed by optical scopes. Spectroscopy fingers diatomic carbon (C2) or CN for green, dust for gold or red—but the time-series is spotty. Community takes, from Stefan Burns and others, spotlight timing with planetary setups and brightness leaps as potential clues. These are hypotheses, awaiting full spectra. Remember, many images are processed composites; filters and software matter. Calibrated spectroscopy cuts through the noise. Gaps in data leave room for all views.

    What It All Might Mean

    Here’s what holds up: 3I/ATLAS is interstellar, survived its October 29 perihelion, displayed verifiable photometric and color changes via multiple scopes, and got X-rayed on December 3. Uncertainties swirl around drivers—C2 outgassing, dust shifts, thermal effects, or processing quirks? Fragmentation’s a wild card; it outlasted perihelion where C/2025 K1 didn’t. To nail it down, chase time-resolved spectra in optical, IR, and X-ray. Watch for breakup or flares, and log your imaging setups for transparency. Share data for cross-checks. Scientifically, this peeks at extrasolar materials, challenging comet models. Culturally, those colors hook us, fueling stories about interstellar visitors. Mainstream analysis carries weight, but curiosity from all sides drives the hunt. Weigh the evidence yourself—what patterns do you see?

    Frequently Asked Questions

    3I/ATLAS is the third confirmed interstellar object, first reported by the ATLAS survey on July 1, 2025, with pre-discovery images dating back to June 14, 2025. It passed perihelion on October 29, 2025, and will make its closest approach to Earth on December 19, 2025, at about 1.8 AU.

    Multiple telescopes, including Gemini South and North, captured redder hues pre-perihelion and a faint greenish coma on November 26, 2025. Spectroscopy suggests diatomic carbon (C2) for the green, while amateur and professional images report golden tones, though processing effects could influence perceptions. XMM-Newton’s X-ray data from December 3, 2025, may provide more on molecular composition.

    Agencies like NASA and ESA explain changes via physical mechanisms like thermal lag and volatile release, emphasizing spectroscopy. Community analysts, including figures like Stefan Burns, note timing with planetary alignments and brightness shifts, seeing potential patterns. Debates continue without consensus, as full time-series spectra are incomplete.

    It survived perihelion on October 29, 2025, unlike the unrelated C/2025 K1, which turned gold and broke apart after its closer pass. Ongoing monitoring for brightness changes or breakup is key, with X-ray results possibly clarifying stability.

    They offer clues to the object’s composition from beyond our solar system, testing cometary physics models. Culturally, the changes draw attention and spark narratives in observer communities, blending science with broader curiosity.

  • Giant Skeletons & the Smithsonian: What Survived the Dig

    Giant Skeletons & the Smithsonian: What Survived the Dig

    Key Takeaways

    • Archival records support widespread 19th- and early-20th-century newspaper reports of ‘very large’ or ‘giant’ skeletons (often 7–9 feet) and unusual features from mound excavations, with a peak in the 1880s–1910s.
    • Claims of a deliberate Smithsonian cover-up, including the destruction of thousands of giant skeletons, stem from modern satire and fiction, contested by fact-checkers and lacking verifiable institutional evidence.
    • Unresolved questions focus on the fate of reported remains sent to the Smithsonian, the accuracy of sensational press descriptions, and whether any surviving specimens could reveal genuine anomalies through modern analysis.

    When the Shovels Hit the Earth at Dusk

    Picture a fading sun over rural Midwest fields in the late 1800s. Local farmers and antiquarians gather around ancient mounds, picks and shovels in hand, the air thick with the scent of freshly turned earth. Word spreads fast in these small towns—whispers of buried secrets unearthed as the day’s light dims. Newspapers chase the story, hungry for headlines that grip readers. One account from the St. Paul Pioneer Press in 1888 captures the scene: workers in Clearwater pull seven skeletons, each measuring seven to eight feet, from the soil. Excitement builds. Reporters spin tales of enormous frames and bizarre traits, feeding the era’s taste for the extraordinary. Tools clink against bone. Locals crowd closer, eyes wide. What lies beneath?

    What Witnesses and Analysts Report

    Those on the ground—farmers, diggers, and early explorers—described finds that still echo in community lore. Skeletons towering seven to nine feet, some with extra fingers or toes, double rows of teeth, even strands of red or blonde hair clinging to ancient skulls. These details surfaced in local papers, painting a picture of something far from ordinary. Alternative researchers today pull these threads together, compiling lists from hundreds of old clippings. Books by folks like Dewhurst and Zimmerman lay it out plain: patterns of oversized remains shipped off to places like the Smithsonian, only to vanish from records. Witnesses spoke with certainty back then, and their accounts matter— they reflect what people saw, or thought they saw, in those mounds. It’s not just tall tales; it’s a shared history demanding respect.

    Timelines, Tracks, and Hard Data

    The trail starts in the 1870s, peaks through the 1880s and 1890s, and fades by the 1910s. Newspapers buzzed with reports, like that 1888 St. Paul Pioneer Press piece on seven- to eight-foot skeletons. Heights often hit seven to nine feet in original accounts, though later compilations sometimes stretch to twelve. For the backbone, look to Cyrus Thomas’s 1894 Report on the Mound Explorations from the Smithsonian’s Bureau of Ethnology—available online via the Internet Archive or Smithsonian repositories. It details investigations and collections, but skips the sensational giants. Fact-checks from AP, Reuters, and Snopes pin the ‘destroyed thousands’ story to 2014 satire, with Smithsonian officials pushing back. Scholars like Andy White and Dr. Michael Heiser warn that phrases like ‘double rows of teeth’ might be loose journalism, not hard anatomy. The evidence is strongest in those primary press clips and institutional reports, but trails go cold without matching museum specimens.

    Claim Source Archival Traceable?
    Seven skeletons, 7–8 ft from Clearwater mound St. Paul Pioneer Press (1888) Unknown
    Mound explorations and collections activity Cyrus Thomas Report (1894) Yes
    Smithsonian destroyed thousands of giant skeletons Modern viral stories (2014+) No
    Anomalies like double rows of teeth Various 1880s–1890s newspapers Unknown

    Official Story vs. What the Data Suggests

    The Smithsonian stands firm: their Bureau of Ethnology ran legitimate mound studies, detailed in Thomas’s 1894 report, with no policy of suppressing giants. Modern spokespeople reject any cover-up outright. Fact-checkers agree, linking the destruction narrative to fiction. Yet community voices point to patterns—clusters of similar reports across papers, suggesting something more than hype. Professional archaeologists note the era’s spotty digs and flowery writing could inflate details; ‘enormous’ might mean robust, not giant. Still, gaps persist. Some remains might have arrived, then got lost in old catalogs or re-labeled plainly. Others could be outright exaggerations or hoaxes. Or perhaps a few hold real mysteries. The data hints at archival holes and media flair, but doesn’t erase the eyewitness conviction. We weigh both sides here, keeping the door cracked.

    How to Follow the Threads: Researcher’s Checklist

    Ready to dig deeper? Start with Cyrus Thomas’s 1894 report—grab it from the Smithsonian repository or Internet Archive, then cross-check sites against their accession ledgers. Transcribe those 19th-century clippings: hunt dates, papers, and quotes for key cases. It’s a priority step. Query Smithsonian catalogs and state historical societies for mound names tied to stories; if accession numbers pop up, request full docs and provenance. Draft FOIA requests for shipment logs and early ledgers—templates can help streamline that. If provenanced bones surface, push for radiocarbon dating, bone measurements, pathology checks, and DNA where allowed. These moves turn curiosity into solid leads.

    What It All Might Mean

    Boil it down: 19th-century mounds yielded documented finds in Thomas’s 1894 report and a flood of local press, heavy on sensational details. But specific anomalies often lack traceable specimens, and the big cover-up tale roots in modern fiction, not institutional proof. Mysteries linger—where did those shipped remains go? The story hits home for us: it probes trust in records, how hype shapes history, and what evidence really means for bold claims. For readers tracking the unexplained, this underscores method over myth. Chase transcripts of those clippings, scour ledgers at museums, and advocate for fresh looks at any material that emerges. Share what you find; we’re in this together.

    Frequently Asked Questions

    No, according to Smithsonian statements and fact-checks from AP, Reuters, and Snopes. The claim traces back to satire and fiction starting around 2014, with no supporting evidence in institutional records.

    Hundreds of 19th-century newspaper accounts describe large skeletons (7–9 feet) and anomalies from mound digs, peaking in the 1880s–1910s. Compilations by researchers aggregate these, but many lack surviving museum specimens or clear accession trails.

    The Smithsonian’s Bureau of Ethnology documented mound explorations in Cyrus Thomas’s 1894 report, focusing on scientific accounts. They deny any suppression and attribute viral cover-up stories to misinformation.

    Key unknowns include the fate of remains reportedly sent to the Smithsonian, the literal accuracy of sensational press descriptions like ‘double rows of teeth,’ and whether modern tests on any surviving specimens could confirm anomalies.

    Search Cyrus Thomas’s 1894 report and Smithsonian accession ledgers. Transcribe original newspaper clippings, query historical societies, and use FOIA for records. If bones emerge, advocate for dating and DNA analysis.

  • Metallic Dust from Satellites: The Hidden Fallout Above

    Metallic Dust from Satellites: The Hidden Fallout Above

    Key Takeaways

    • Satellite launches have exploded since 2020, fueled by megaconstellations like Starlink, leading to thousands of new objects in low Earth orbit and a sharp rise in annual reentries, according to public trackers and launch statistics from Our World in Data and Statista.
    • Verified data from US catalogs and agencies show around 31,000 trackable objects larger than 10 cm, with peer-reviewed studies detecting hundreds of tonnes of aluminum-bearing particles entering the upper atmosphere each year from satellite ablation, as reported in PNAS 2023 and NASA technical memos.
    • Major unknowns persist, including whether these stratospheric metals reach the ground in harmful amounts—models suggest possible ozone and climate impacts under high-growth scenarios, but ground-level contamination links remain mostly anecdotal and unverified (GRL 2024; npj 2025).

    A Silent Convoy Beneath the Night Sky

    Picture this: it’s a clear evening in a quiet suburb, and a resident steps outside to stargaze. Suddenly, a slow, bright streak cuts across the sky—not a shooting star, but something steadier, leaving a lingering trail that hangs like a ghostly ribbon. Hours later, locals notice a fine dust settling on cars and lawns, described in community posts as a metallic powder or white residue. Reports like these have multiplied on Reddit threads and YouTube channels, such as those from Stefan Burns, tying into the surge of satellite activity since 2020. Launch rates have climbed steeply, turning rare sights into regular occurrences. People aren’t panicking; they’re observing, questioning, and connecting dots. The urgency builds from patterns that feel too consistent to ignore, stirring a mix of curiosity and concern among those who’ve long tracked anomalies in the skies.

    What Witnesses and Analysts Report

    Across online forums and independent channels, witnesses describe vivid scenes: bright reentry trails that linger far longer than typical meteors, followed by reports of metallic dust or fine powder coating surfaces nearby. These accounts have ramped up with the satellite boom, as communities point to an uptick in such events. Independent analysts like Stefan Burns have documented these through videos and commentaries, linking sky phenomena to satellite reentries and raising questions about environmental fallout. Patterns emerge in the reports—streaks mistaken for meteors or launch plumes, calls for testing local deposits, and a sense that industrial space activity is spilling over into daily life. Many of these remain anecdotal, with peer-reviewed science focusing more on high-altitude aerosols than confirmed ground-level ties to specific reentries. Still, these voices provide raw data points that deserve scrutiny, reflecting a growing network of observers piecing together what’s falling from above.

    Timelines, Tracks, and Hard Data

    The evidence builds from public catalogs and studies. By early 2024, USSPACECOM-derived data and NASA visualizations tracked about 31,000 objects in orbit, mostly in low Earth orbit where congestion is highest. Launch numbers tell the story: from a few hundred annually in the 2010s to thousands between 2020 and 2024, per Our World in Data and Statista stats. Peer-reviewed work, including PNAS 2023 and NOAA campaigns, has spotted metals in stratospheric aerosols—around 10% of particles sampled show spacecraft reentry signatures. Estimates put annual aluminum ablation at 100–300 tonnes, with models in GRL 2024 and npj 2025 warning of ozone and radiative effects if growth continues unchecked. The ESA’s Space Environment Report 2024/2025 highlights debris growth and Kessler syndrome risks, urging mitigation.

    For a quick reference, here’s a summary of key metrics:

    Metric Value Source
    Trackable objects ~31,000 NASA SVS / USSPACECOM (early 2024)
    Estimated annual Al/Al2O3 ≈100–300 t/yr PNAS 2023 / NASA TM
    Per-satellite Al2O3 example ~30 kg per 250-kg satellite NASA estimates
    Model conclusions Ozone sensitivity under high-growth scenarios GRL 2024 / npj 2025

    Visuals help: check ESA’s orbital density heatmaps, launch timelines from Statista, diagrams of stratospheric particle transport, and annotated eyewitness videos matched to verified reentry times via Celestrak.

    Official Story vs. What the Data Suggests

    Agencies like ESA stress the growing debris problem in their 2024/2025 reports, warning of collision risks and pushing for satellite passivation and removal. NASA and US bodies track objects, note reentry byproducts in memos, and advocate for better monitoring. NOAA and academic teams, through PNAS 2023 and similar, confirm stratospheric metals from spacecraft and model potential ozone hits, but they stay measured, calling for more research. Communities extend this to ground-level ‘metallic rain,’ demanding tests and seeing an immediate threat— a view that amplifies official concerns but jumps ahead of solid evidence for widespread terrestrial contamination. Both sides align on rising launches injecting materials into the atmosphere and the need for oversight. Differences show in scope: officials focus on high-altitude chemistry and uncertainties, while witnesses highlight local impacts that science hasn’t fully bridged yet. These reports stand as leads worth following, without dismissing the gaps.

    What It All Might Mean

    The core facts hold: satellite numbers are climbing, reentries are dumping metal particles into the stratosphere, and models point to ozone and heating risks if unchecked. Questions linger on ground deposition in usable forms, precise particle details from new satellites, and Kessler cascade odds tied to policy. This matters for air quality, climate recovery, and space sustainability—readers, local groups, and regulators can push for lidar monitoring, reentry reporting, and better satellite designs. Take action: collect samples credibly, urge agency transparency, and support global debris rules. Mystery endures, but targeted steps could curb the fallout before it escalates.

    If You Want to Test It: Practical Steps for Credible Local Sampling

    Prioritize safety: wear gloves and N95 masks; avoid touching or inhaling unknowns. Collect samples with clean tools into sealed containers, noting GPS, time, weather, and chain-of-custody—grab controls from unaffected spots. Target metals via ICP-MS, particle sizes, and XRD/SEM at university labs or accredited testers. Link to reentries using USSPACECOM tracks and weather data, but isotopic fingerprinting is key for provenance. When sharing, include lab details and uncertainties for transparency.

    Frequently Asked Questions

    Megaconstellations like Starlink have driven a massive increase in launches, with thousands of satellites added to low Earth orbit. Public data from Our World in Data and Statista show annual launch rates multiplying compared to the 2010s. This boom heightens reentries and visible sky events.

    Peer-reviewed studies confirm hundreds of tonnes of aluminum particles in the stratosphere from reentries, per PNAS 2023 and NASA reports. However, links to ground-level contamination are mostly anecdotal, with limited verified sampling tying specific deposits to satellites. More research is needed to trace the full pathway.

    Agencies like ESA and NASA acknowledge debris growth and atmospheric injections, warning of collision risks and ozone impacts in reports and models. They call for monitoring and mitigation but emphasize uncertainties, differing from community views on immediate ground threats. Both agree on the need for better data and policies.

    Follow safety protocols with gloves and masks, collect samples with documentation, and send to labs for metal analysis. Cross-reference with reentry trackers like Celestrak. Remember to note uncertainties and use controls for credibility.

    Models in GRL 2024 and npj 2025 suggest reentry particles could perturb ozone recovery and radiative balance under high-growth scenarios. Outcomes depend on particle details, which remain uncertain. Agencies urge more study to assess long-term atmospheric effects.

  • Giant Spiders in Canada: What the Evidence Shows

    Giant Spiders in Canada: What the Evidence Shows

    Key Takeaways

    • Eyewitnesses often describe ‘giant’ spiders in cabins, docks, and garages, and dramatic beach strandings of long, ribbon-like worms; social posts rarely include scale references.
    • Verified data: Dolomedes spiders reach about 5–9 cm across, ribbon worms can extend multiple meters, and polar gigantism explains oversized marine arthropods; invasive mosquitoes are expanding ranges but not body size.
    • Open questions: most reports lack scale or specimens, under-sampled regions could hide surprises, and shifting mosquito risks blur abundance with perceived gigantism.

    A Night at the Cabin: Hand-sized Shadows and Strandline Mysteries

    Late summer at a lakeside cabin: docks creak, dusk deepens, and suddenly a shadow or an unfamiliar shape stalls your step. On storm-swept coasts, waves withdraw to reveal slick, elongated forms on the sand. These settings concentrate reports: boathouses, porches, and strandlines where people spot ‘giant’ spiders or long worms. Short clips and forum posts amplify these moments, often without reliable scale or specimens, which makes them memorable but hard to validate.

    What Witnesses and Local Storytellers Describe

    People report ‘dock’ or ‘fishing’ spiders as hand-sized, and coastal witnesses describe ribbon-like or ‘sea caterpillar’ strandings after storms. Mosquito accounts are usually about swarms that feel overwhelming rather than single oversized insects. These narratives spread on social platforms, local blogs, and community groups; consistency in descriptions is notable, even when measurements are absent.

    Timelines, Tracks, and Hard Data

    Here are verifiable points: Dolomedes spiders commonly cited in inland and nearshore reports measure roughly 5–9 cm across. Ribbon worms such as Lineus longissimus are known to reach multiple meters (5–15 m verified; longer anecdotal reports exist). Polar gigantism has been recorded in some sea spiders and other polar invertebrates. Mosquito vectors like Aedes albopictus are expanding northward, tracked by public health agencies, but there is no evidence of substantial insect body-size increases. Surveillance for diseases such as West Nile virus in Canada has been ongoing since the early 2000s.

    Official Story vs. Community Readings

    Museums and entomologists generally identify the ‘giant’ land spiders as Dolomedes within known size ranges. Marine scientists explain long strandings through the biology of ribbon worms and report polar gigantism where applicable. Public health agencies monitor mosquito range and disease risk rather than sensational size claims. Communities, however, often interpret dramatic finds as extraordinary, and social media can leave questions unresolved when no specimen or scale is provided.

    What It All Might Mean

    Most viral ‘giant’ sightings fit established species and phenomena: Dolomedes spiders of hand-sized proportions, long but stretchable ribbon worms, and genuine cases of polar gigantism. The key gaps are the many unmeasured viral posts and rare, under-sampled regions where unexpected discoveries remain possible. For practical action: document unusual finds with a clear scale object, preserve specimens when safe, and contact local museums, universities, or extension services. Journalists and researchers should recruit citizen scientists and coordinate identifications to close the evidence gap.

    Frequently Asked Questions

    They report hand-sized spiders near water, ribbon-like worms on beaches after storms, and aggressive or abundant mosquitoes rather than singularly huge insects.

    Data support Dolomedes up to about 9 cm and very long ribbon worms; there is no verified evidence of major body-size jumps in mosquitoes or other common insects.

    Officials favor species-based explanations and documented phenomena; communities often interpret dramatic findings as mysterious or cryptid-like, especially when samples are not collected.

    Photograph the subject with a clear scale (ruler, coin), take multiple angles, avoid harming protected species, and contact a local museum, naturalist group, or entomology department for identification.

    Climate change and human movement allow species like Aedes albopictus to expand northward, increasing vector-borne disease risk; this is about range and abundance, not larger individual mosquitoes.

  • Solar Storms and Japan’s Megaquake Alert: Hidden Risk

    Solar Storms and Japan’s Megaquake Alert: Hidden Risk

    Key Takeaways

    • Japan issued its first Nankai Trough “megaquake advisory” after the M7.1 Hyūga-nada event on 8 August 2024, signaling elevated probability rather than a definite forecast, according to JMA and Reuters reports.
    • Peer-reviewed studies, like a 2020 Scientific Reports paper, show statistical correlations between solar-wind parameters such as proton density spikes and short-term increases in large earthquakes, though these are contested and don’t prove causation.
    • NOAA and NASA track prolonged coronal-hole high-speed streams causing recurrent geomagnetic activity; planetary conjunctions are predictable but their gravitational pull on Earth is negligible compared to the Moon and Sun, with mainstream seismology from USGS and JMA finding no proven link between space weather and earthquakes.

    A Silent Convoy Beneath the Dark Sea

    Picture the rugged coasts of Japan under a low-hanging sky, where the sea whispers against the rocks and distant buoys flash in the night. Communities here, long accustomed to the ground’s subtle shifts, now sit in a tense quiet, eyes on the horizon for signs of trouble below. The Nankai Trough, a historical hotspot for megathrust quakes, carries a government-estimated 60–80% chance of a major event within 30 years. Recent shakes—like the Hyūga-nada M7.1 on 8 August 2024 and the Noto Mw7.5 on 1 January 2024—have heightened the watch. Meanwhile, the Sun’s been unleashing large coronal holes and high-speed streams for months, tracked by NOAA’s Space Weather Prediction Center, stirring geomagnetic ripples that echo in the feeds. People feel it: the air charged, the wait heavy, as if something vast is moving unseen beneath the waves.

    What Witnesses and Analysts Report

    Independent researchers and community voices are piecing together patterns that official channels often overlook. Figures like Stefan Burns, through his website and YouTube, link recent seismic swarms, ongoing coronal-hole high-speed streams, and an approaching planetary alignment in early 2026 into a narrative of cosmic convergence. On forums like Reddit, Telegram, and YouTube threads, observers share accounts of unusual seismic clusters, strange precursor feelings, erratic animal behaviors, and even anecdotal electromagnetic disturbances—these are raw reports from the ground, not lab-controlled data. Proposed mechanisms vary: some point to geomagnetically induced currents shifting pore pressures in faults, others to piezoelectric responses in crustal rocks or resonances between ionospheric turbulence and deep fault lines. They highlight timing overlaps and correlations from targeted studies, urging a closer look at these potential triggers.

    Timelines, Tracks, and Hard Data

    Readers, here’s the raw trail you can follow yourself. Seismic catalogs from USGS and JMA, advisories from Reuters, NOAA’s coronal-hole plots—these are the anchors. Check the 2020 Scientific Reports paper for its statistical analysis of proton density spikes correlating with M>5.6 quakes on a ~1-day lag; it includes caveats on methods and scope. NOAA SWPC details how high-speed streams cause recurrent G1–G2 geomagnetic storms over solar rotations, unlike abrupt CMEs. Space.com and Astropixels note multi-planet groupings in February–April 2026, though such alignments aren’t rare. USGS FAQs firmly state no causal tie between space weather and quakes. For quick reference:

    Metric Value Source
    Hyūga-nada Earthquake M7.1 – 8 Aug 2024 USGS event page
    Noto Earthquake Mw7.5 – 1 Jan 2024 Earth, Planets & Space paper
    JMA Nankai Trough Advisory First issuance after Aug 2024 Reuters/JMA
    Nankai Multi-Decadal Probability ~60–80% Government/panel summaries

    Official Story vs. What the Data Suggests

    Agencies like JMA lean on real-time monitoring and probabilistic models for their Nankai advisories, emphasizing elevated short-term risks without claiming certainty. USGS focuses on tectonic stress, fault dynamics, and historical patterns, maintaining no established link from space weather to seismic events. NOAA and NASA map how high-speed streams and CMEs disrupt the magnetosphere and induce ground currents, but stop short of tectonic claims; planetary gravity effects pale next to lunar and solar tides. Yet, papers like the 2020 Scientific Reports introduce statistical signals with short lags, provisional findings that critics say need tighter controls and believable mechanisms. It’s a split: institutions stick to recurrence models, while alternative readings highlight these contested correlations as hints of overlooked influences.

    What It All Might Mean

    The Nankai zone’s high hazard and Japan’s advisory after recent M7+ quakes stand as solid warnings; months of coronal holes and high-speed streams are confirmed in the data. Still, questions linger: Are those solar-wind to earthquake correlations holding up against biases? Could magnetospheric forces reach seismogenic depths with real impact? Might space weather nudge a megathrust rupture’s odds? Authorities and readers alike should monitor seismic swarms, geomagnetic indices, and alignment timelines. For navigating this, here’s a quick checklist:

    • Verify with primary sources like JMA, USGS, and NOAA before sharing.
    • Separate correlation from proven cause.
    • Watch for selection bias in pattern-spotting.
    • Build earthquake prep habits, theories aside.

    If you want raw USGS/JMA pages or NOAA plots, drop a request—we’ll attach them. And remember, social media can amplify noise; cross-check to cut through the fog.

    Frequently Asked Questions

    Japan issued its first Nankai Trough advisory after the M7.1 Hyūga-nada earthquake on 8 August 2024, highlighting elevated short-term probability based on monitoring, not a guaranteed prediction.

    Some peer-reviewed studies, like the 2020 Scientific Reports paper, report statistical correlations between solar-wind spikes and increased large quakes with short lags, but these are contested and don’t establish causation. Mainstream seismology from USGS and JMA sees no proven causal link.

    Reports from forums and independent analysts include seismic swarms, odd sensations, animal behaviors, and electromagnetic anomalies, tied to mechanisms like induced currents or resonances. These are anecdotal, pointing to timing coincidences with space weather events.

    Officials rely on tectonic models and historical data, dismissing space weather triggers, while alternative analyses highlight statistical patterns and propose electromagnetic or gravitational influences as potential short-term factors.

    Track seismic activity in the Nankai region, geomagnetic storms from NOAA, and the 2026 planetary alignments. Use primary sources and prepare for earthquakes regardless of cosmic theories.