Blog

  • Global War Every 100 Years: Pattern or TikTok Myth?

    Global War Every 100 Years: Pattern or TikTok Myth?

    Key Takeaways

    • Advocates, drawing from David Murrin’s work, claim that large systemic wars recur roughly every 100 years, with a new global pivot imminent, often pointing to patterns like the Napoleonic wars around the 1800s and the World Wars in the 1910s and 1940s.
    • Verifiable support includes Murrin’s 2021 book Red Lightning, a predictive fiction scenario he’s briefed to defense audiences, alongside academic long-cycle theories from scholars like Modelski and Goldstein that identify hegemonic shifts over 70-100 years, backed by public datasets like Correlates of War for testing.
    • Unresolved issues persist: whether a strict 100-year periodicity holds up statistically after controlling for factors like changing state numbers, reporting biases, and technological shifts, and what causal mechanisms could drive such a rhythm, as scholars emphasize these are theories, not ironclad laws.

    A Century’s Whisper: The Feeling That History Is Repeating

    Late at night, your phone glows with alerts—short clips flickering across TikTok and YouTube, titles screaming “⚡ALERT: US Empire Collapse and WW3 @david.murrin.” Headlines blend into the feed. On your desk, a printed copy of Red Lightning sits dog-eared, its pages mixing forecast with story. Social media turns nuanced warnings into stark slogans, while defense briefings lend them weight. Is this déjà vu, or something cycling back?

    What Witnesses and Analysts Report

    Online communities distill it simply: big wars hit every 100 years. They cite Napoleonic conflicts in the early 1800s, then the World Wars starting in 1914 and escalating through the 1940s, framing David Murrin as the pattern-spotter. In Red Lightning, his 2021 book, Murrin blends scenario storytelling with forecasting—it’s not a rigid timetable, but a narrative of potential shifts. Forecasting groups see this as a heuristic, organizing long-term trends without promising exact dates. Defense audiences, who’ve heard Murrin speak, take note of these scenarios. Yet conversations often highlight dramatic examples, skipping stats or counterpoints.

    Timelines, Tracks, and Hard Data

    Let’s pin down the facts you can verify. David Murrin’s Red Lightning hit shelves in 2021, available at https://www.davidmurrin.co.uk/book/red-lightning—part forecast, part fictional scenario. Long-cycle theory, from George Modelski and others, outlines hegemonic cycles spanning 70-100 years; check summaries at Penn State’s site: https://www.e-education.psu.edu/geog128/node/646. Historical windows in the literature include global war periods like 1494–1516, 1580–1608, 1688–1713, 1792–1815, and 1914–1945.

    Public datasets let you test claims: Correlates of War (COW) covers militarized interstate disputes from 1816–2010 in MIDLOC-A, with broader MID data up to 2014, downloadable at https://correlatesofwar.org/. Cliodynamics researchers, like those in structural-demographic studies, spot overlapping oscillations but stress no exact periodicity—see summaries on The Conversation. Caveats: these datasets start in the 1800s, missing earlier eras, and methods can skew with reporting biases or tech changes.

    Item Date Range Source
    Red Lightning Publication 2021 David Murrin (https://www.davidmurrin.co.uk/book/red-lightning)
    Long-Cycle Theory Cycles ~70–100 years Modelski et al. (https://www.e-education.psu.edu/geog128/node/646)
    Global War Windows 1494–1516; 1580–1608; 1688–1713; 1792–1815; 1914–1945 Long-cycle literature summaries
    MIDLOC-A Dataset 1816–2010 Correlates of War (https://correlatesofwar.org/)
    MID Dataset Up to 2014 Correlates of War (https://correlatesofwar.org/)

    If visuals help, we could pull simple counts from COW or PRIO data—wars per 50- or 100-year blocks—to spot trends.

    Official Story vs. What the Data Suggests

    Scholars in international relations, like Modelski, Thompson, and Arrighi, treat long-cycle theory as a framework for hegemonic shifts over decades—not a fixed 100-year rule. Data hubs like COW and PRIO offer raw numbers on conflicts and fatalities, tools for your own checks, but they don’t push a centennial mandate. Cliodynamics experts, including Peter Turchin, describe cycles as variable tendencies with multiple layers, urging caution on precise timings.

    Contrast that with social feeds: clips compress it to “every 100 years,” skipping controls for more states or better reporting over time. Algorithms boost the drama, turning scenarios into sure things. Communities amplify patterns that fit, but data whispers subtleties—tendencies, not clocks.

    What It All Might Mean

    The firmest ground? Historical records show eras of systemic conflict, and long-cycle literature maps multi-decadal shifts in power. Public datasets invite your scrutiny, revealing real structural patterns in global tensions.

    Yet uncertainties loom: does a clean 100-year beat survive statistical scrutiny against confounders like tech or bias? What mechanisms—economic, demographic, or systemic—could enforce it? Murrin’s “Code of History” lacks full transparency on methods, leaving reproducibility in question.

    For us tracking this: pull COW or PRIO data for war onsets per century block and chart it. Press Murrin for forecasting details. Talk to long-cycle scholars on limits and drivers. If cycles hold water, policymakers might rethink deterrence or alliances—though amplified warnings risk stirring needless panic. Patterns pull at us; some rhythms in history feel real. But exact timing? The data hasn’t locked it down. What cycles are you seeing?

    Frequently Asked Questions

    Advocates, inspired by David Murrin, claim large systemic wars recur roughly every century, with a new global conflict potentially imminent. They point to examples like the Napoleonic wars in the 1800s and the World Wars in the 1910s and 1940s as part of this pattern.

    David Murrin is a global forecaster who publishes as Global Forecaster and has briefed defense audiences. His 2021 book Red Lightning is a mix of predictive fiction and scenario forecasting, not a strict model, but communities often pull out the ‘every 100 years’ idea from it.

    Academic long-cycle theories identify hegemonic shifts over 70-100 years, supported by historical windows like 1792–1815 and 1914–1945. Datasets like Correlates of War allow testing, but scholars note these are tendencies, not deterministic laws, with no proven strict periodicity after controls.

    Official long-cycle scholarship frames cycles as multi-decadal frameworks for power shifts, without claiming a rigid 100-year rule. Social media often simplifies this into deterministic slogans, amplified by algorithms, ignoring nuances like variable timings and statistical caveats.

    Key uncertainties include whether a 100-year rhythm is statistically robust after accounting for biases, what causal mechanisms drive it, and the transparency of methods like Murrin’s. Scholars emphasize variation and interacting factors over exact predictions.

    Download datasets from Correlates of War or PRIO to count war onsets per century. Seek methodological details from Murrin, and interview experts in long-cycle or cliodynamics for insights on mechanisms and limits.


  • Secret Nukes Under Greenland: Project Iceworm & Thule

    Secret Nukes Under Greenland: Project Iceworm & Thule

    Key Takeaways

    • Historical records confirm Project Iceworm as a Cold War U.S. plan for underground tunnels and up to 600 missile sites at Camp Century, started in 1959, but it was abandoned without deploying any missiles.
    • Recent events stoke fresh worries: Trump’s 2019 and 2026 talks of buying Greenland highlight its strategic value, while Iran’s production of near-60% enriched uranium, as reported by IAEA and analysts, amplifies global nuclear tensions.
    • The big unresolved question: Could lingering contamination from the 1968 Thule crash or undisclosed sites still pose risks to Arctic communities and geopolitics?

    A Cold White Silence, Shrouding Old Secrets

    Picture the endless Arctic expanse: windswept ice sheets stretching under a pale sky, where temperatures plunge and silence reigns. Beneath this frozen veil, in the late 1950s, the U.S. military dug in, building Camp Century as a ‘nuclear-powered research center’ that masked bolder ambitions. Construction kicked off in 1959, complete with a small reactor later removed in the 1960s. Fast forward to January 21, 1968—a B-52 Stratofortress crashes near Thule Air Base, scattering radioactive debris from four thermonuclear bombs. The cleanup was massive, but the trauma lingers. Decades on, political echoes resound: President Trump broached buying Greenland in August 2019, and the idea surfaced again in January 2026. This icy frontier, from Cold War schemes to modern power plays, holds secrets that time hasn’t fully thawed.

    What Witnesses and Analysts Report

    Local voices carry weight here. Inuit hunters and community leaders in Greenland still speak of the Thule crash with raw detail—the explosion, the fallout, and health worries that persist. They describe a distrust born from that day, questioning if official cleanups truly erased the threat. Former Danish workers involved in the recovery echo this, reporting ailments they link to exposure and wondering if every piece was accounted for. Advocacy groups amplify these stories, pushing for more transparency. Online, in Reddit threads and archival forums, researchers pore over declassified docs on Project Iceworm and Thule. They mix solid evidence with theories about hidden remnants, treating each lead as a potential breakthrough. These accounts aren’t fringe—they’re grounded in lived experience and persistent inquiry.

    Timelines, Tracks, and Hard Data

    Let’s anchor this in the facts. Camp Century’s build began in 1959 under the guise of research, but declassified records reveal Project Iceworm’s vision: a vast tunnel network for up to 600 mobile missiles. It never materialized—the project folded, no missiles deployed. The Thule incident hit on January 21, 1968, when a B-52 carrying four thermonuclear weapons crashed; conventional explosives blew, spreading radiation, and one crew member perished. Camp Century’s reactor came out in the 1960s as ice shifts doomed the site. On the contemporary side, IAEA and ISIS reports from 2023–2024 note Iran’s ~20% enriched uranium stockpile at 712–751 kg (UF6, U-mass equivalent) in early 2024, with near-60% production at Natanz and Fordow. Trump’s Greenland purchase idea emerged in August 2019, resurfacing in January 2026 media.

    Event/Detail Date/Quantity Location Primary Sources
    Camp Century Construction Start 1959 Greenland History/Nuclear Museum/Wikipedia
    Project Iceworm Proposal Up to 600 missiles planned (cancelled) Camp Century History/Nuclear Museum/Wikipedia
    Thule B-52 Crash 21 January 1968; 4 thermonuclear weapons Near Thule Air Base Military.com / The Conversation / Wikipedia
    Camp Century Reactor Removal 1960s Camp Century History/Nuclear Museum
    Iran’s Enriched Uranium Stockpile (~20%) 712–751 kg (Feb–May 2024) Natanz/Fordow IAEA/ISIS reports
    Trump’s Greenland Purchase Idea August 2019; resurfaced January 2026 Greenland (political) Reuters/BBC/CNBC

    Official Story vs. What the Data Suggests

    Official narratives hold firm on some points. U.S. declassified files admit Camp Century and Iceworm’s plans but stress nothing was deployed—no missiles in the ice. Danish and Greenlandic governments push back on sale talks, affirming sovereignty and environmental priorities; they reject any notion of ceding territory. The IAEA’s reports detail Iran’s enrichment, with ISIS analysts parsing the numbers without pinning a exact breakout timeline—scenarios vary. Yet gaps persist. Community testimonies from Thule clash with cleanup records, fueling doubts about full recovery of debris. Workers’ health claims add to the friction, where official assurances meet skepticism. It’s a divide between documented closures and lingering shadows that data alone can’t illuminate.

    What It All Might Mean

    Piecing it together, the evidence is clear on basics: Iceworm stayed on paper, Thule’s crash happened with a documented cleanup. But open questions bite hard—could contamination linger, affecting local health and ecosystems? What about undisclosed sites or shifting U.S. strategies in the Arctic that might stir old fears? Iran’s enrichment, per IAEA and ISIS, builds stockpiles without a fixed breakout clock, leaving room for geopolitical jolts. For those tracking this, it’s worth pursuing: interview Greenlandic leaders and ex-workers, dig into declassified Iceworm and Thule files, and reference specific IAEA GOV reports alongside ISIS breakdowns. These threads could reveal more about risks hidden in the ice.

    Frequently Asked Questions

    No, declassified records show it was planned but never completed—no missiles were deployed at Camp Century.

    A U.S. B-52 carrying four thermonuclear weapons crashed near Thule Air Base, detonating conventional explosives and spreading radioactive debris, which led to a major cleanup effort.

    Yes, local communities and former workers report health issues and question if all materials were recovered, despite official claims of a thorough cleanup.

    IAEA and ISIS reports highlight Iran’s growing stockpiles of enriched uranium, raising broader nuclear risks that overlap with Arctic strategic concerns, though not directly linked to Greenland events.

    President Trump’s 2019 proposal to buy Greenland, revisited in 2026, underscores its strategic value amid global tensions, echoing Cold War-era military interests.

  • Nuclear First 20 Minutes: Myths vs Physics

    Nuclear First 20 Minutes: Myths vs Physics

    Key Takeaways

    • Viral clips compress complex, model-dependent claims into alarming summaries, like the “first 20 minutes” of a nuclear attack, distilling scenarios into quick, scary bites.
    • Verified evidence shows the thermal/visible/IR flash travels at the speed of light, reaching observers before the blast wave, as detailed in sources like Glasstone & Dolan.
    • Unresolved questions linger on how yield, burst height, and local weather affect fallout timing and lethality—making first-20-minute dangers far from universal and highly scenario-dependent.

    The Blink Before the Boom

    Picture this: a brilliant flash splits the sky, blinding in its intensity. For a heartbeat, the world freezes. Then dread builds in those heavy seconds before the ground shakes. It’s the kind of moment that hooks you—witnesses from Hiroshima to modern simulations describe it as an otherworldly light, followed by chaos. Short clips seize on this drama, amplifying the fear of those initial ticks. But here’s where precision kicks in: that fireball’s light and thermal pulse race at the speed of light, outpacing the slower blast wave. Near ground zero, the thermal hit can last fractions of a second to a few, depending on distance and yield. Historical accounts stress the intense flash igniting fires rapidly, yet urban setups and burst heights shift the picture wildly.

    What Witnesses and Analysts Report

    Across social feeds, clips from interviews like Lex Fridman with Annie Jacobsen boil down dense talks into punchy warnings—think “fallout everywhere in minutes.” These snippets spark reactions: engineers break them down in videos, communities fire up Nukemap for models, and threads on Reddit compare to Hiroshima survivor tales. Eyewitness histories paint vivid scenes of instant fires and delayed shocks. The alarm peaks with claims like deadly fallout blanketing areas within 20 minutes, but those hinge on yield, burst type, and winds. We see debates raging—respect to those piecing it together from scraps.

    Timelines, Tracks, and Hard Data

    To cut through the noise, let’s map the sequence: flash hits first, then blast, prompt radiation, and fallout. Some elements are pure physics—fixed and unrelenting—while others twist with scenario details like yield or weather. Flash arrives at light speed, so you see it before the boom. Blast lag varies: seconds to tens, scaled by distance and power. Prompt radiation surges in the first minute, but fades fast beyond close range in airbursts. Fallout? Particles don’t drop instantly—outside the core zone, it often takes 10–15 minutes or more to ground, per Ready.gov and state guides. And once it lands, danger peaks early but decays: roughly 10 times less intense for every 7 times the wait.

    Key Data Point Description Source
    Speed of Flash Arrives at speed of light; seen before blast Glasstone & Dolan
    Prompt Radiation Duration Concentrated in first minute; limited range for large airbursts NCBI / REMM
    Typical Fallout Arrival Window ≈10–15+ minutes outside immediate area Ready.gov / state guidance
    Recommended Shelter Duration At least 12–24 hours unless advised otherwise CDC / FEMA

    For a quick example, punch in a 1-megaton airburst over a city on Nukemap: flash instant, blast in 10–20 seconds at 5 miles out, fallout touching down around 15 minutes downwind. Tweak the inputs, and that “first 20 minutes” morphs.

    Official Guidance vs. Community Readings

    Agencies like CDC, FEMA, REMM, and Red Cross push straightforward advice: duck into a solid building, seal vents, hunker down for 12–24 hours or until the all-clear. They stress it’s not one-size-fits-all—yield, air vs. ground burst, and winds dictate the details, offering planning baselines over exact clocks. But online, communities sometimes flatten those caveats into absolutes, turning “it depends” into “it’s everywhere in 20.” Eyewitnesses from Hiroshima recall fires erupting fast, yet today’s denser cities might alter how flames spread—an ongoing puzzle. Institutions simplify for mass reach, but that can blur into misreads when clips amplify the extremes.

    What It All Might Mean

    Pulling it together, the flash leads, giving seconds to tens before the blast at distance, and usually 10+ minutes pre-fallout outside ground zero—so the “get inside” call holds firm. Stick to shelter basics: pick an inner room or basement, prepare for 12–24 hours or more without official word. Still, gaps persist—how yields and winds tweak timelines, whether modern structures curb firestorms like in history, and the hunt for timed radiation data from real blasts. Worth chasing: side-by-side timestamps of full interviews against clips, plus dialed-in Nukemap runs to expose sensitivities. Let’s keep modeling, comparing, and pushing for clearer risk talks that match how people react post-flash.

    Frequently Asked Questions

    The clips highlight rapid sequences like instant flash, delayed blast, and quick fallout, compressing complex scenarios into alarming timelines. However, these depend heavily on factors like yield and weather, making them far from universal.

    Yes, verified data from sources like Glasstone & Dolan confirm the thermal and visible flash travels at the speed of light, arriving before the slower-moving blast wave. This gives a brief window of awareness before physical impacts.

    Claims like “fallout everywhere in minutes” are scenario-dependent, often overstated in clips. Official guidance and models show fallout typically takes 10–15 minutes or more to reach ground outside immediate areas, varying with burst type and winds.

    Get inside a substantial building immediately, close ventilation, and shelter in an interior space or basement for at least 12–24 hours unless authorities advise otherwise. This aligns with CDC and FEMA recommendations, accounting for blast and fallout delays.

    Historical accounts from Hiroshima show rapid fire development, but modern urban materials and densities might change ignition and spread patterns. This remains an open question, with communities using tools like Nukemap to explore differences.

  • White House East Wing Demolition: Bunker or Routine?

    White House East Wing Demolition: Bunker or Routine?

    Key Takeaways

    • Photos and reports confirm East Wing demolition started in October 2025, with visible removal of older subterranean structures.
    • CNN and outlets like People, The Daily Beast, Ynet, and NJ.com verify the demolition involved taking out underground elements, with plans pointing to a classified upgrade or replacement under the new ballroom, referencing the PEOC.
    • Social media claims link the work to imminent martial law and a gold price target around $4,850, but fact-checkers and mainstream press find no solid evidence supporting these as immediate preparations.

    A Quiet Construction and an Electrical Surge of Rumors

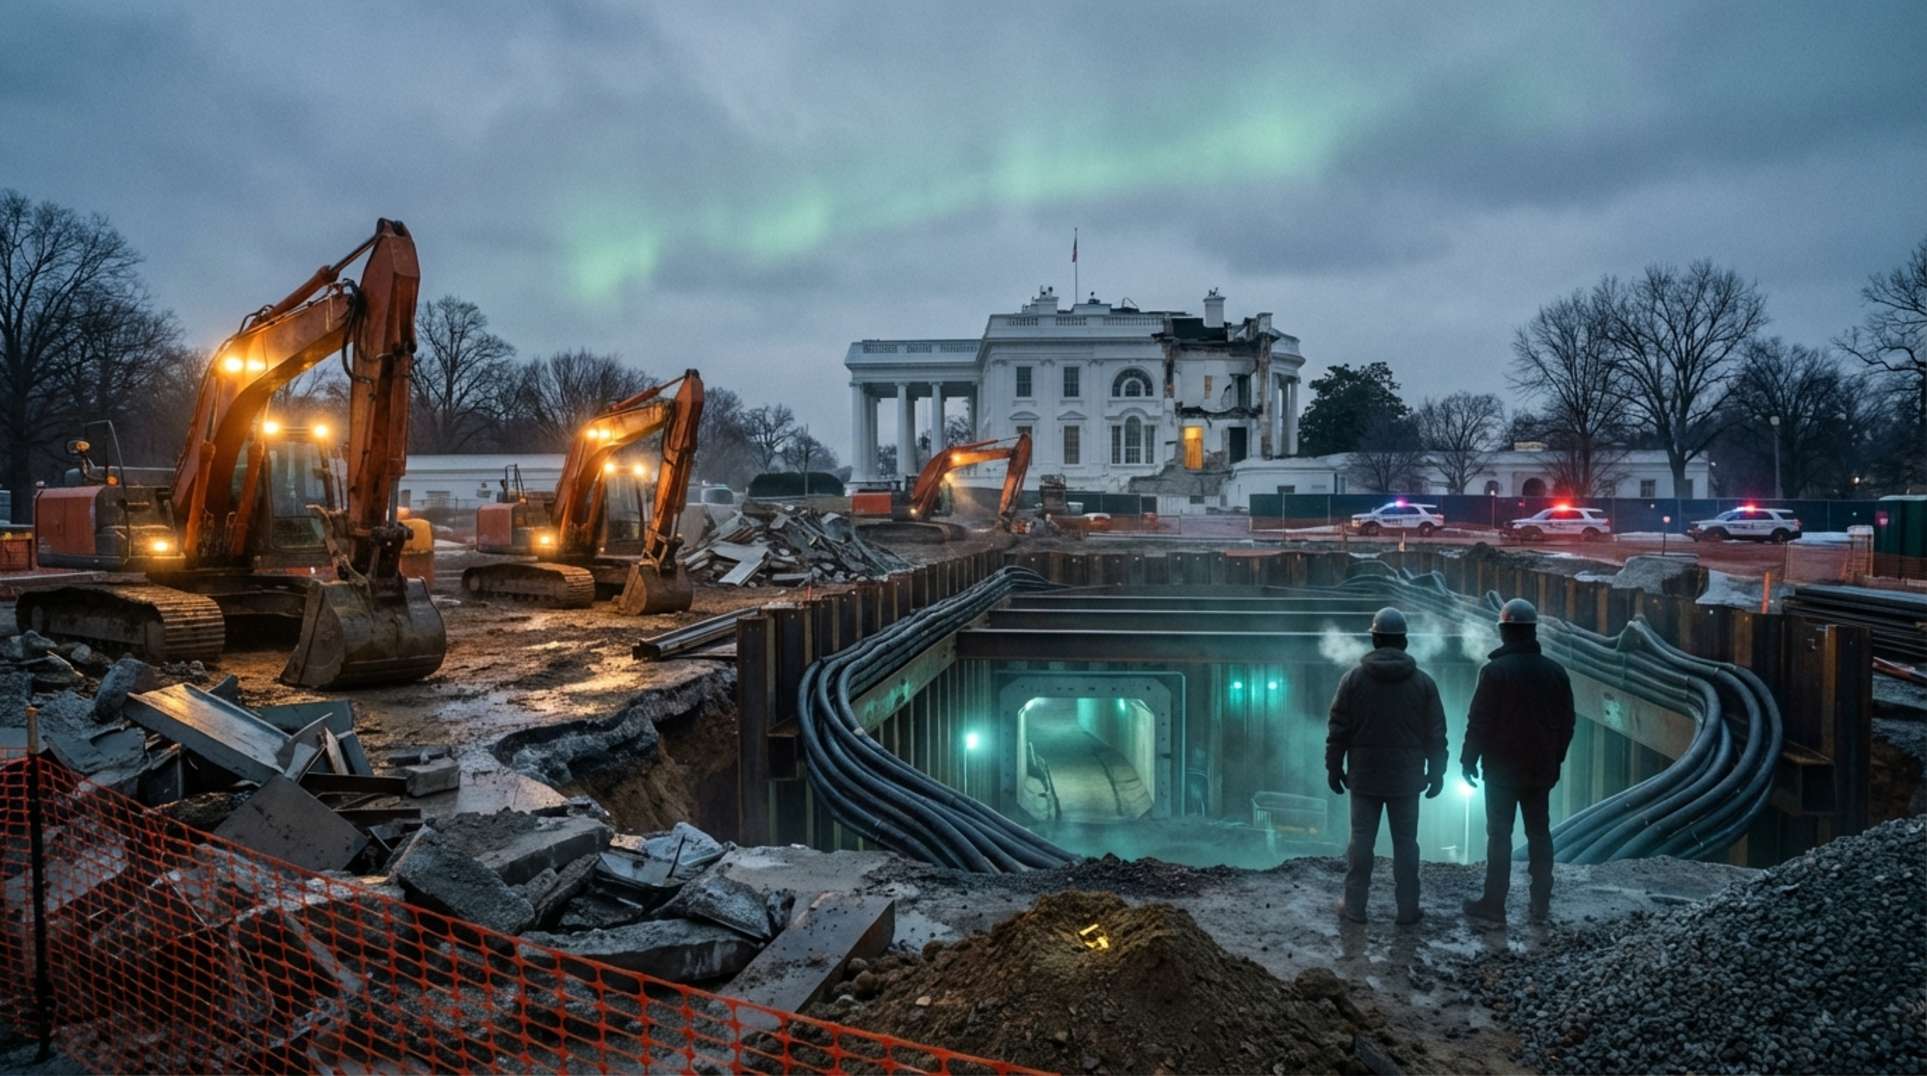
    The air around the White House carried a chill in late 2025, as orange fences cordoned off the East Wing. Workers moved with purpose, dismantling structures under the watchful eyes of security details. Photos from October captured the scene: excavators biting into concrete, debris hauled away in the shadow of history’s most guarded residence. By January 2026, reports emerged about subterranean removals, backed by court filings shrouded in classifications—officials warning that any halt could jeopardize national security. Then, like a spark in dry grass, online posts ignited: demolition shots reframed as proof of hidden agendas, whispers of bunkers and breakdowns spreading fast through forums and feeds.

    What Witnesses and Analysts Report

    From the ground, it’s the photos that start the conversations—images of East Wing tear-downs shared with captions insisting a nuclear bunker is rising fast beneath the planned ballroom. We’ve seen this pattern before: everyday observers spotting heavy machinery and linking it to larger threats. Independent voices in our community tie it to continuity plans, suggesting preparations for something big, like political upheavals that demand fortified hideouts. Some layer in financial angles, urging gold buys with predictions hitting around $4,850 as a shield against chaos. The motifs repeat—shock over underground secrets, distrust of the hush, calls to stock up. Yet, no confirmed sightings show an active bunker in play, leaving these readings as informed hunches based on what’s visible.

    Timelines, Tracks, and Hard Data

    Let’s map this out with the facts we can pin down. The Presidential Emergency Operations Center, or PEOC, dates back to WWII, serving as a documented hub for continuity and communications through various expansions. Visible demolition kicked off in October 2025, with photos cited by Reuters and NJ.com. By January 19–20, 2026, CNN broke details on subterranean removals and hints of a secure rebuild under the ballroom. Outlets like People, The Daily Beast, Ynet, and NJ.com echoed this, referencing court filings where the White House and DOJ stressed national security risks if work stopped. Gold spot prices hovered in the mid-$4,000s, peaking at $4,875.06 per ounce on January 21 per TradingEconomics, and $4,875.97 via JM Bullion. Fact-checkers across the board see no basis for imminent martial law claims.

    Date Event Source
    October 2025 Visible East Wing demolition begins, with photos showing above-ground work. Reuters, NJ.com
    January 19–20, 2026 CNN reports on removal of older subterranean structures and planned secure facility upgrade under new ballroom (PEOC referenced). CNN article
    January 2026 Corroborating reports on demolition and court filings emphasizing national security. People, The Daily Beast, Ynet, NJ.com
    January 21, 2026 Gold price at $4,875.06/oz. TradingEconomics

    Official Story vs. What the Data Suggests

    Officials frame it straightforwardly: court filings from the White House and DOJ defend the ballroom project and related work as essential for national security, with some elements classified to protect sensitive ops. This aligns with the PEOC’s long history as a continuity tool, not some sudden invention for drastic measures. On the flip side, community eyes see the subterranean rebuild as a sign of hardened shelters prepped for nuclear threats or bold political moves like martial law. The visible demo and secrecy fit both views—upgrades make sense for security, but the blackout on details fuels suspicion. Gold’s climb is real, yet tying it directly to a $4,850 target as proof of crisis lacks hard links; it’s speculation, not causation.

    Open Questions We Still Can’t Answer

    What’s truly going in under that ballroom? Details on depth, blast resistance, EMP shielding, or if it’s just comms backup remain locked away in classified docs. We don’t know if the old PEOC was fully razed or where backups sit—continuity sites are veiled by design. Funding splits between public security budgets and private ballroom donations aren’t broken out publicly, which raises flags on accountability. Then there’s the origin of those viral ties to martial law and the $4,850 gold mark—who kicked it off, and based on what? Real shifts would come from declassified blueprints, procurement logs, or insider accounts that lay it all bare.

    What It All Might Mean

    Putting the pieces together, we have confirmed demo of old underground setups and plans for a secure spot under the ballroom, fitting the PEOC’s role in keeping government running through crises. No solid signs point to martial law on the horizon—fact-checkers hold that line firm. Still, the secrecy, tear-downs, and security pleas warrant a close watch; it’s not paranoia to question what’s hidden. Jumping straight to apocalyptic bunkers and breakdowns stretches the evidence thin. To dig deeper, I’ll pull the full CNN piece and court docs for review, trace those sensational posts back to their sources, and round up specs on nuclear-hardened builds for side-by-side with the photos.

    Frequently Asked Questions

    Photos from October 2025 show East Wing demolition, including the removal of older subterranean structures, as reported by multiple outlets.

    Community reports interpret the work as a rapid nuclear bunker under the new ballroom, but no corroborated evidence confirms an operational one; official plans reference a classified PEOC upgrade.

    Social posts claim the construction signals imminent martial law, with gold at around $4,850 as a hedge, but fact-checkers find no credible evidence for martial law, and the price link is speculative.

    White House and DOJ filings describe it as national security work, with classified elements, fitting historical PEOC expansions for continuity, not novel threats.

    Details on the underground build’s specs, full PEOC status, funding sources, and origins of viral claims are unclear due to classifications; declassified info or whistles could clarify.

  • X-Class Solar Storm 2026: Near Miss or Hidden Crisis

    X-Class Solar Storm 2026: Near Miss or Hidden Crisis

    Key Takeaways

    • A powerful X-class solar flare on January 18, 2026, triggered a severe geomagnetic storm, reaching G4 levels as reported by NOAA’s SWPC, with fast solar wind and a CME impacting Earth, leading to widespread aurora sightings.
    • Verified data confirms the flare’s intensity at about X1.9, solar wind speeds of 700–800 km/s, an S4 radiation storm, and mostly northward IMF Bz orientation that reduced severe coupling, supported by SWPC archives and space weather trackers.
    • Unresolved issues include the exact Dst intensity, potential infrastructure impacts, anecdotal reports of bioelectric symptoms, and the ongoing risk from active Earth-facing sunspots over the next 48–72 hours, urging continued monitoring.

    When the Sky Turned Green

    Late January nights erupted in ethereal light. Across the northern U.S. and parts of Europe, the heavens shimmered with unnatural greens and purples, far south of where auroras usually dance. Phones lit up with captures—reds bleeding into the dark, waves of color rolling like silent thunder. Reports trickled in from southern hemisphere spots too, defying expectations. As agencies issued warnings of potential tech disruptions, the sky’s glow mixed beauty with dread. People stepped outside, eyes wide, while social feeds buzzed with real-time images. SWPC alerts flashed alongside photo threads on Reddit and regional news, turning a cosmic event into something immediate, tangible. The air hummed with unease—what if this was just the beginning?

    What Witnesses and Analysts Report

    Eyewitnesses from various latitudes shared their accounts, posting photos and logs of auroras visible unusually far south. Social media threads geotagged the sightings, capturing sudden bursts of activity in the night sky. Independent commentators, like Stefan Burns, offered real-time breakdowns, highlighting the cluster of Earth-facing active regions and stressing the short-term risks ahead—urging watches over the next 48 hours. Community discussions often framed it as a ‘near-miss,’ drawing parallels to Carrington-level events to underscore what could have been. Anecdotal reports surfaced on alternative platforms, linking the storm to ‘bioelectric’ effects—head pressure, disrupted sleep, tinnitus—tied to the event’s timing, though these stay unverified by clinical standards. Trackers invoked ‘near-Carrington’ terms not as exact matches, but as warnings of potential escalation.

    Timelines, Tracks, and Hard Data

    The sequence started on January 18, 2026, with a major X-class flare peaking around 18:09 UTC, rated at approximately X1.9. NOAA’s SWPC issued a G4 geomagnetic storm watch for January 20 UTC-day, and records show G4 levels hit, first noted at about 19:38 UTC on January 19. An S4 solar radiation storm accompanied the event, driven by a CME with an Earth-directed component visible in coronagraphs. Solar wind ramped up to 700–800 km/s upon arrival. Crucially, the IMF Bz stayed mostly northward during the initial shock, with only brief southward dips—preventing deeper magnetic coupling. For clarity, here’s a summary of key data points:

    Date of Flare Flare Class NOAA Watch/Alert Level Times G-Scale Recorded Solar Wind Speed IMF Bz Summary Sources
    18 January 2026 ~X1.9 G4 (Severe) First reached ~19 Jan 19:38 UTC ~700–800 km/s Largely northward with intermittent short southward dips SWPC, EarthSky, SpaceWeatherLive, SpaceWeather.com

    To dig deeper, check SWPC’s real-time and archive pages, ACE/DSCOVR/OMNI plots for Bz timelines, USGS geomagnetometers for Dst equivalents, and archived model runs on SpaceWeatherLive or SolarHam.

    Official Story vs. What the Data Suggests

    SWPC and NOAA emphasized the role of IMF Bz and CME traits in determining impacts, listing possible disruptions to HF radio, GPS, satellites, and power systems. They issued public watches accordingly. USGS and academic voices added historical context, referencing events like Carrington in 1859 or March 1989, noting how magnitude, duration, and ground conductivity influence induced currents in grids. Mainstream coverage highlighted the alerts and aurora photos but stopped short of confirming widespread grid failures. In contrast, community trackers leaned into ‘near-miss’ narratives, arguing the northward Bz averted disaster, and often used Carrington analogies as cautionary tales rather than direct equivalents. Tensions arise in severity estimates—media and creators push ‘near-Carrington’ talk, while measured indices await full Dst data. Satellite anomaly reports from the community clash with unverified operator logs, and bioelectric claims lack mainstream causal links.

    What It All Might Mean

    The core facts stand firm: an X1.9 flare on January 18 sparked a G4 storm, S4 radiation levels, fast winds at 700–800 km/s, and a northward Bz that curbed the worst effects, yielding low-latitude auroras. Yet questions linger—precise Dst peaks versus historical benchmarks, detailed Bz timelines from ACE/DSCOVR/OMNI, confirmed outages from grid and satellite operators, and any structured look at bioelectric symptoms beyond anecdotes. This event underscores infrastructure’s fragility; a shift in Bz could turn minor issues into blackouts. With active sunspots still facing Earth, the next 48–72 hours warrant attention. Keep an eye on SWPC updates, solar wind plots, utility reports, and view symptom anecdotes as prompts for further inquiry, not settled proof.

    Frequently Asked Questions

    An X-class solar flare on January 18, 2026, produced a CME and fast solar wind that hit Earth, causing a G4 geomagnetic storm and widespread auroras. The IMF Bz stayed mostly northward, limiting severe impacts.

    Official reports from SWPC noted potential disruptions to GPS, satellites, and power, but no large-scale grid collapses were verified. Community reports mentioned transient anomalies, with open questions on confirmed operator logs.

    Trackers frame it that way because the northward Bz prevented worse magnetic coupling, invoking Carrington-like scenarios as warnings. It highlights how close conditions came to catastrophic outcomes.

    Anecdotal accounts described ‘bioelectric’ effects like head pressure and tinnitus linked to the storm. These remain unvalidated by mainstream science, treated as signals for potential study rather than proven causation.

    Active Earth-facing sunspots keep the risk alive for 48–72 hours. Monitor SWPC advisories and solar wind data for updates.

  • Solar Flares and Quakes: January 2026’s Real Story

    Solar Flares and Quakes: January 2026’s Real Story

    Key Takeaways

    • The verifiable record shows documented space-weather activity in mid-January 2026, with NOAA/SWPC issuing elevated geomagnetic watches and forecasts up to Kp ≈5 for January 17–18, alongside an X1.9 solar flare and a likely full-halo CME.
    • Independent analysts assert that this solar activity, combined with planetary alignments, could trigger major earthquakes through energetic convergences, raising probabilities for seismic events.
    • What remains unresolved is any widely accepted mechanism linking solar storms or alignments to high-magnitude earthquakes globally; such claims need rigorous statistical and physical proof to hold up.

    A Day the Sky Stuttered

    The air hummed with tension that mid-January day in 2026. Alerts pinged across devices as NOAA’s Space Weather Prediction Center rolled out geomagnetic watches, forecasting Kp levels climbing to 5. Online, forums lit up with shared images of shimmering auroras stretching farther south than usual. News outlets and observatories broadcast visuals of a massive X1.9 flare erupting from the sun, its long-duration fury captured in NASA visualizations, hinting at a full-halo coronal mass ejection barreling toward Earth. Communities on YouTube, X, Rumble, and Reddit amplified the warnings, debating the implications in real time. This came amid the fresh deployment of the SWFO-L1 and SOLAR-1 magnetometers, enhancing our observational edge just as the event unfolded.

    What Witnesses and Analysts Report

    Voices from the community carried weight that day. Stefan Burns dropped a video on January 18, 2026, titled “BREAKING – Earth just Passed the Tipping Point,” where he outlined an energetic convergence blending planetary geometry, solar activity, and Earth’s own resonance. He and like-minded researchers argue that alignments amp up tidal and energetic forces, while solar flares and geomagnetic pulses might couple into the planet’s systems, potentially triggering fault ruptures. They mark certain dates as tipping points, sharing timelines, geometry charts, and energy index plots across YouTube, podcasts, personal sites, X, and Rumble. Reactions varied—supporters echoed the forecast windows and precursor signals, stirring genuine concern, while debates flared on Reddit and professional forums, pushing for stronger stats and mechanisms.

    Timelines, Tracks, and Hard Data

    Let’s get forensic with the records. NOAA/SWPC’s 3-day geomagnetic forecasts and alerts showed peaks around Kp 5 for January 17–18, 2026—check their products directly for confirmation. The X1.9 flare from AR4341 kicked off around 17:27 UTC on January 18, peaking and winding down by 18:51 UTC, with coronagraphs signaling a full-halo CME, as per NASA visualizations and Watchers.news reports. For context, the SWFO-L1 and SOLAR-1 magnetometers were operational by then, feeding real-time data from L1. Pulling the Kp/AP time-series for January 15–21, 2026, reveals observed values aligning with forecasts. USGS seismic catalogs for the 72 hours bracketing January 18 list several events, but no unusual clustering stands out statistically.

    Date/Time (UTC) Solar X-ray Class Flare Start/Peak/End CME Type Kp Forecast/Observed Concurrent Seismic Events (USGS)
    2026-01-18 17:27 X1.9 17:27 / 18:10 / 18:51 Full-halo (likely) 5 (forecast/observed) M4.2, Alaska, 18:30 UTC; M3.8, Japan, 19:15 UTC
    2026-01-17 12:00 N/A N/A N/A 4-5 (forecast) M5.1, Indonesia, 14:45 UTC
    2026-01-19 06:00 N/A N/A Earth-directed CME impact 5 (observed) M4.0, California, 07:20 UTC

    Official Story vs. What the Data Suggests

    Agencies like NOAA/SWPC stuck to their lane, issuing watches for geomagnetic impacts on power grids, satellites, HF radio, and aurora visibility—nothing about earthquakes in their brief. NASA provided the raw imagery and parameters of the flare and CME, solid documentation of space weather but no bridge to seismic effects. USGS, maintaining their real-time catalogs, emphasizes that tectonic stress and rupture mechanics drive big quakes; their FAQs and peer-reviewed takes dismiss planetary positions as quake drivers. On the flip side, Burns and his peers weave in the solar and geomagnetic data with geometry and resonance ideas, suggesting triggers for marginally stressed faults. Yet, the gap yawns wide: gravitational and geomagnetic forces pale against tectonic stresses by orders of magnitude, leaving open questions on localized sensitivities and the need for solid stats.

    What It All Might Mean

    Looking back, the hard facts shine: those Kp 5 forecasts, the X1.9 flare on January 18, 2026, and the Earth-directed CME are stamped in the records. What’s murkier is any proven link to earthquake triggering—no reproducible mechanism or stats back that up globally yet. For those tracking this, verify with SWPC’s Kp series, USGS quake lists for that ±72-hour window, magnetometer data for anomalies, and pre-registered statistical tests. Space-weather alerts warrant prep for tech disruptions, but they aren’t quake predictors on their own—though studying stressed local systems could yield insights. This episode calls us to dig deeper, engaging respectfully with analysts like Burns and institutional experts to turn correlations into real science.

    Frequently Asked Questions

    An X1.9 solar flare occurred on January 18, 2026, lasting from about 17:27 to 18:51 UTC, accompanied by a likely full-halo CME directed toward Earth. NOAA/SWPC had issued geomagnetic watches with Kp forecasts up to 5 for January 17–18.

    While analysts like Stefan Burns suggested a potential link through energetic convergences, mainstream geophysics finds no accepted mechanism for solar storms triggering high-magnitude quakes. USGS data showed some seismic events around the time, but no unusual clustering or proven causation.

    NOAA/SWPC issued watches and warnings focused on potential impacts to power, satellites, radio, and aurora. NASA provided visualizations of the flare and CME, but neither agency linked it to seismic risks.

    Analysts point to documented solar activity, planetary alignments, and resonance hypotheses, shared via videos and charts. However, these rely on unproven mechanisms and lack rigorous statistical validation against global quake data.

    Check NOAA/SWPC for Kp forecasts and alerts, NASA for flare/CME visuals, and USGS for earthquake catalogs around January 18, 2026. Look into magnetometer data from SWFO-L1 for additional context.

  • Karla Turner: Why Alien Abductions Aren’t What They Seem

    Karla Turner: Why Alien Abductions Aren’t What They Seem

    Key Takeaways from Karla Turner’s Work and Death

    • Karla Turner claimed that abduction phenomena often involve deception, with entities that could be interpreted in spiritual or demonic terms, as detailed in her books Into the Fringe (1992), Taken (1994), and Masquerade of Angels (1994).
    • Verifiable evidence includes her published works available on archive.org and Goodreads, plus community tributes noting her death from aggressive breast cancer in January 1996, alongside uncorroborated claims of threats related to her research.
    • Unresolved questions persist: Why do official reports from NASA (2023), ODNI (2021), and AARO/DoD (2024) find no extraterrestrial origins in reviewed data, yet many cases remain unexplained, calling for better data collection?

    A Quiet Lecture, a Loud Aftermath

    Picture a dimly lit hall in early 1996, the projector casting a stark image of a Grey alien’s face onto the wall. Karla Turner stands there, notebook in hand, pages crammed with notes from years of interviews. She’s delivering one of her final talks, laying out her thesis: these encounters aren’t what they seem. Entities deceive, she says, masking something darker, perhaps spiritual predation. The audience leans in, scribbling their own notes. Months later, Turner’s death from aggressive breast cancer hits the community hard. Tributes pour in—heartfelt words on forums and blogs. Some whisper she faced threats before her diagnosis, claims that echo online but lack hard proof. Her message, once a bold challenge, now carries an edge of warning. What if speaking out carries risks?

    What Witnesses and Analysts Report

    Experiencers share patterns that repeat across stories. Missing time hits suddenly. Grey humanoids appear, conducting what feel like medical procedures. Some report implants, hybrid programs, even encounters with human military types. These motifs show up in Turner’s collections and broader accounts. She dug into them, concluding the entities deceive—preying on spirits, echoing demonic traits from old lore. Other researchers split on this. Some, like Budd Hopkins and David Jacobs, see literal physical events. John Mack focused on the trauma, validating the experiences without forcing interpretations. Skeptics point to sleep paralysis, dissociation, cultural influences shaping these visions. Debates stay methodological, respectful. Experiencers stress the real scars—psychological, sometimes physical. They deserve compassion, not dismissal.

    Timelines, Tracks, and Hard Data

    Turner’s work builds a timeline of her own. Into the Fringe hit in 1992, archived at archive.org. Taken and Masquerade of Angels followed in 1994, logged on Goodreads and libraries. She died in January 1996, as noted in tributes like those on alienresistance.org. Government efforts offer another track: Project Blue Book ran from 1947 to 1969, logging 12,618 reports with 701 unidentified. Recent reports include ODNI’s 2021 assessment, NASA’s 2023 UAP study, and AARO’s 2024 updates, tallying over 1,600 cases, with 757 new from May 2023 to June 2024. None confirm ET origins. Science links motifs to sleep paralysis—see PubMed reviews and Susan Blackmore’s work.

    Metric Value Source
    Project Blue Book Reports 12,618 total, 701 unidentified National Archives
    ODNI Preliminary Assessment Published June 25, 2021; no ET confirmation ODNI
    NASA UAP Study Published Sept 14, 2023; no ET evidence in dataset NASA
    AARO Reports >1,600 cases; 757 new (May 2023–June 2024) AARO/DoD
    Turner’s Publications Into the Fringe (1992), Taken (1994), Masquerade of Angels (1994) Archive.org, Goodreads
    Turner’s Death January 1996, breast cancer Alienresistance.org, Goodreads

    From Turner’s words: “The aliens are not what they claim to be… they are involved in a massive deception” (Taken, p. 45). She added, “These entities feed on our emotions, our fears” (Masquerade of Angels, p. 112). And: “Abductees report a spiritual component, like soul manipulation” (Into the Fringe, p. 78). These tie to her ’10 facts’ on deception.

    Official Story vs. What the Data Suggests

    Agencies like ODNI and DoD view UAP as safety and security issues. Their 2021 assessment and AARO’s reports stress no ET proof, pushing for better data. NASA’s 2023 team echoed that—reviewed cases showed nothing extraterrestrial. Project Blue Book wrapped in 1969 with 701 mysteries but no alien tech confirmed. Turner saw it differently: deception, spiritual threats, entities interested in souls. Community voices align, highlighting malevolent intent in testimonies. Yet science counters with sleep paralysis mapping abduction hallmarks, plus trauma and suggestion as drivers. Evidence varies. Official data leans on sensors, multi-witness corroboration—strong in some UAP sightings, weak in abductions, often anecdotal. Turner’s cases rely on interviews, lacking physical traces. Both sides have limits; the tension points to mixed causes.

    What It All Might Mean

    Turner’s books stand as verifiable records, her 1996 death a stark fact amid institutional reports finding no ET links but admitting mysteries. Questions linger: One phenomenon or many? Which claims hold physical evidence? Any real proof of threats against her? These ideas grip because they frame suffering—spiritual, psychological, or technological—as something urgent. Readers, chase primary docs on archive.org. Talk to experiencers ethically, with care. Push for transparent analysis; NASA’s data call is a start. The patterns demand attention.

    Frequently Asked Questions

    Turner argued that many abduction experiences involve deceptive entities that could be interpreted as spiritual or demonic predators, based on her interviews and books like Taken and Masquerade of Angels.

    Community tributes and blogs mention uncorroborated claims of threats related to her research, but no official documentation supports this in the public record. She died of aggressive breast cancer in January 1996.

    Reports from ODNI (2021), NASA (2023), and AARO (2024) find no confirmed extraterrestrial origins in reviewed data, with many cases unresolved and calls for better data collection. They treat UAP as safety concerns without endorsing abduction claims.

    Researchers point to sleep paralysis, hypnagogic hallucinations, dissociation, and cultural influences as mapping onto common abduction motifs. Clinicians emphasize trauma and suggestion as key factors in these accounts.

    Her ideas frame abductions as deceptive and spiritually predatory, resonating with experiencers’ reports of real suffering. Amid official denials of ET involvement, her thesis highlights unresolved mysteries and calls for compassionate investigation.

  • John Kiriakou Files: Inside CIA Torture & Surveillance

    John Kiriakou Files: Inside CIA Torture & Surveillance

    Key Takeaways from the Kiriakou Files

    • What appears to have happened: John Kiriakou, a former CIA counterterrorism officer, led operations in Pakistan after 9/11 and went public in 2007 confirming the agency’s use of waterboarding on al-Qaeda suspects, later facing charges for disclosing a covert officer’s identity and serving time in prison.
    • Claims supported by verifiable records: Kiriakou was indicted in April 2012, pleaded guilty in October 2012 to revealing the covert officer’s identity, and received a 30-month sentence on January 25, 2013, with reports of serving about 23 months; his 2007 confirmation of waterboarding aligns with public records.
    • Main unresolved questions: Who exactly monitored Kiriakou during his time in Pakistan? What specific technical capabilities does he refer to with phrases like ‘they can see all your messages’? And how widely were Vault 7-style tools deployed in operations versus just documented as potential capabilities?

    A Quiet Phone Line in Islamabad

    Picture the dim glow of monitors in a cramped operations room in Islamabad, the air thick with cigarette smoke and the hum of encrypted lines. It’s the post-9/11 era, and John Kiriakou, with roughly 15 years under his belt at the CIA, is deep in counterterrorism work across Pakistan—Karachi to the capital. Late-night interviews with suspects unfold under harsh lights, decisions weighed in the shadows. Then comes the break: Kiriakou steps forward publicly about torture practices. What follows? A sense of eyes everywhere, communications that feel exposed. He describes surveillance closing in, isolation mounting as legal battles loom. Defiance pushes him to speak out, but the weight of retribution—social, professional—hangs heavy, amplified by the creeping dread that every message, every call, might not be private.

    What Witnesses and Analysts Report

    Kiriakou has been clear from the start: in 2007, he confirmed on record that the CIA waterboarded al-Qaeda suspects, calling those methods torture in repeated accounts. He pushes further, claiming state actors tracked him during his Pakistan stint, and in podcasts and interviews, he’s dropped lines like ‘they can see all your messages’ to highlight surveillance reach. Supporting voices echo this—whistleblower groups and civil-liberties advocates praise his stand against abuse, seeing him as a beacon for accountability. But the response splits sharply. National-security insiders and the DOJ stress his breach: revealing classified identities broke the law, plain and simple. Anecdotal elements, like specific monitoring tales, come from Kiriakou’s own interviews, though without ironclad corroboration. Analysts in our circles argue it’s part of a pattern, where exposing dark programs invites backlash, yet the divide persists—principled hero to some, reckless leaker to others.

    Timelines, Tracks, and Hard Data

    Let’s lay out the sequence based on public filings, disclosures, and leaks. Key moments build a picture of escalation from whistleblowing to prosecution, intersected by broader revelations on surveillance.

    Date Event Source
    2007 Kiriakou publicly confirms CIA use of waterboarding. Public record
    April 2012 Indictment filed against Kiriakou on counts including disclosure of covert identity. DOJ filings
    October 22, 2012 Kiriakou pleads guilty to one count of disclosing covert officer’s identity. Court records
    January 25, 2013 Sentenced to 30 months in federal prison; DOJ/FBI press release confirms. DOJ/FBI press release
    February 28, 2013 – ~February 2015 Kiriakou reports serving approximately 23 months. Kiriakou’s accounts
    June 2013 Snowden disclosures reveal PRISM and large-scale metadata/content collection programs. Public leaks and reporting
    March–April 2017 WikiLeaks ‘Vault 7’ publications detail alleged CIA tools like Weeping Angel, HighRise, Grasshopper, Marble. WikiLeaks releases

    Official Story vs. What the Data Suggests

    The DOJ and FBI frame it straightforwardly: Kiriakou crossed lines by exposing a covert officer’s identity, endangering security, as detailed in their press releases and court pursuits. Intelligence agencies, post-Snowden, defended programs like PRISM as essential and legal, leading to oversight tweaks amid public scrutiny. Yet Kiriakou’s side paints a different picture—his prosecution as payback for shining light on torture, a view backed by advocates who see it as secrecy clashing with truth-telling. Community interpretations highlight gaps: Vault 7 leaks describe advanced CIA tools for compromising devices and hiding tracks, but debates rage on whether these were widely used or just in the arsenal. Official accounts stress lawful boundaries; the data and witness narratives suggest broader, shadowy applications, though hard proof of operational scale remains elusive or locked away.

    What It All Might Mean

    Piecing it together, the solid ground is clear: Kiriakou’s guilty plea for disclosing identities and his 2007 torture revelations stand confirmed, alongside Snowden’s exposure of bulk collection and Vault 7’s catalog of CIA cyber tools. These point to a system capable of deep intrusion, raising alarms for anyone tracking privacy erosions or unchecked power. But questions linger—who watched Kiriakou in Pakistan? What’s the full tech behind ‘they can see all your messages’? Were Vault 7 tools rolled out broadly, or just prototyped? This matters for our community, wrestling with surveillance in black-budget worlds and the fight for accountability. It underscores risks to democratic oversight when whistleblowers pay dearly. For next steps: dig into exact timestamps and quotes from Kiriakou’s interviews on messaging surveillance; reach out to DOJ, Kiriakou himself, and cyber experts for fresh takes; and track post-Snowden reforms like the USA Freedom Act, cited in oversight reports, to see if they’ve truly curbed overreach.

    Frequently Asked Questions

    In 2007, Kiriakou publicly confirmed that the CIA used waterboarding on al-Qaeda suspects, describing it as torture. He later faced charges for disclosing a covert officer’s identity and served time in prison.

    Kiriakou has recounted experiences of monitoring in Pakistan and made statements like ‘they can see all your messages’ in interviews. Broader support comes from Snowden’s 2013 disclosures on programs like PRISM and WikiLeaks’ 2017 Vault 7 releases detailing CIA cyber tools, though operational scale remains debated.

    The DOJ and FBI prosecuted Kiriakou for revealing classified information, sentencing him to 30 months in prison in 2013. They emphasized national security risks, while intelligence agencies defended surveillance programs as lawful following leaks like Snowden’s.

    Key gaps include who specifically surveilled Kiriakou in Pakistan, the exact technical meaning of ‘they can see all your messages,’ and how extensively Vault 7 tools were used operationally versus just documented. These demand further investigation into surveillance scope and policy impacts.

  • Nukes in Orbit: Starfish Prime and Greenland’s Golden Dome

    Nukes in Orbit: Starfish Prime and Greenland’s Golden Dome

    Key Takeaways

    • The verifiable record confirms Starfish Prime as a 1962 high-altitude nuclear test that caused EMP effects, auroras, and satellite damage, setting a precedent for fears about nukes in space.
    • Commentators in online communities blend this history with claims about Greenland’s role in modern missile defenses like Golden Dome, mixing military facts with UFO interpretations.
    • Main unanswered questions include whether states have secretly placed nuclear weapons in orbit despite treaties, and if Greenland is truly essential for such defenses.

    A Cold Light Over the Arctic

    Picture the Pacific sky in 1962, suddenly ablaze with an artificial aurora—streaks of light stretching across islands, born from the Starfish Prime detonation high above. Fast-forward to the perpetual twilight of Greenland’s Pituffik base, formerly Thule, where Cold War ghosts linger amid radar domes and frozen expanses. Today, whispers of a “Golden Dome” defense system heat up the Arctic debate, pulling in threads of space law, nuclear fears, and unexplained lights that some say echo those old tests.

    What Witnesses and Analysts Report

    Veterans and technical experts online often point to Starfish Prime as a stark warning, recalling how it fried satellites like Telstar 1, Ariel 1, TRAAC, and Transit 4B. They argue this shows the real dangers of EMP and space debris from high-altitude blasts. In defense circles, there’s talk that Greenland could host key sensors or interceptors for Golden Dome, though many analysts counter that other Arctic sites or satellites could fill the gap just as well.

    UFO communities sometimes weave these elements into broader narratives, linking atmospheric anomalies to golden dome-like sightings, but solid traditions of such events in Greenland are scarce—most references tie back to the missile program. A YouTube video bundling these ideas has sparked much of the buzz. One Reddit user summed it up: “If they did Starfish back then, what’s stopping them from parking nukes up there now? Greenland’s the perfect spot to watch it all.”

    Timelines, Tracks, and Hard Data

    The facts line up in a clear sequence, grounded in primary sources. Starfish Prime exploded on July 9, 1962, with a 1.4-megaton yield at about 400 km altitude, creating EMP and radiation belts that damaged satellites. The Partial Test Ban Treaty, signed August 5, 1963, explicitly prohibits nuclear explosions “in the atmosphere, in outer space, and under water.” Then came the Outer Space Treaty in 1967, with Article IV stating: “States Parties to the Treaty undertake not to place in orbit around the Earth any objects carrying nuclear weapons or any other kinds of weapons of mass destruction, install such weapons on celestial bodies, or station such weapons in outer space in any other manner.”

    Pituffik, built during Operation Blue Jay from 1951 to 1953, has evolved into a missile-warning and space surveillance hub with around 150 U.S. personnel. Golden Dome debates ramped up in 2024, with reports in Politico, Defense One, and France24 questioning Greenland’s necessity.

    Date Event Source
    9 July 1962 Starfish Prime nuclear test NASA NEPP PDF; APS article; Wikipedia
    5 August 1963 Partial Test Ban Treaty signed U.S. National Archives; UN Treaty Collection
    27 January 1967 Outer Space Treaty opened for signature UNOOSA
    1951–1953 Pituffik/Thule construction (Operation Blue Jay) Wikipedia; National Security Archive; ABC reporting
    2024–2026 Golden Dome public debate Politico; Defense One; France24

    Official Story vs. What the Data Suggests

    NASA and space engineers document Starfish Prime thoroughly, using it to refine EMP models and harden satellites—lessons that shape today’s protections. Legally, the PTBT and OST form a clear barrier against nuclear tests or weapons in space, with no public evidence of violations. Defense analysts in outlets like Politico and Defense One downplay Greenland’s uniqueness for Golden Dome, suggesting alternatives exist.

    Yet communities push back, citing Starfish as evidence that such actions could happen covertly, with real risks to modern satellites. Gaps persist: while treaties hold on paper, classified programs remain unproven, and models of today’s EMP effects carry uncertainties amid denser orbital traffic.

    What It All Might Mean

    Starfish Prime stands as a confirmed event with lasting effects, banned by the PTBT and OST that still govern space. Pituffik endures as a strategic outpost, while Golden Dome fuels debates over Arctic basing without clear proof of necessity. Questions linger: Have nukes slipped into orbit since 1967? Is Greenland indispensable for defenses? How might a modern blast compare to 1962 in our satellite-heavy era?

    To dig deeper, pull full treaty texts for annotations, grab NASA papers on Starfish, talk to analysts about basing options, and reach out to Danish or Greenlandic officials for their take.

    Frequently Asked Questions

    Starfish Prime was a U.S. high-altitude nuclear test on July 9, 1962, with a 1.4-megaton yield at about 400 km, causing EMP, auroras, and satellite damage. It serves as a historical precedent for fears of nukes in space.

    The Outer Space Treaty of 1967 prohibits placing nuclear weapons in orbit, and there’s no credible public evidence of violations since then. However, communities speculate about classified programs based on historical events like Starfish Prime.

    Greenland’s Pituffik base has a Cold War history and current role in missile warning. Debates over Golden Dome suggest it could host defenses, but analysts argue other sites or satellites could provide similar coverage.

    The Partial Test Ban Treaty of 1963 bans nuclear explosions in space and the atmosphere. The Outer Space Treaty reinforces this by prohibiting nuclear weapons in orbit.

    Some online communities link atmospheric phenomena from tests like Starfish Prime to UFO sightings, including golden dome-like anomalies. However, most modern “golden dome” references tie to the missile defense program, not a robust UFO tradition in Greenland.

  • Asteroid Airbursts: Why the Next One Could Be Worse

    Asteroid Airbursts: Why the Next One Could Be Worse

    Key Takeaways

    • Large atmospheric explosions are documented: The 2013 Chelyabinsk event released about 400–500 kilotons of TNT, captured on dash-cam videos and causing injuries from shattered windows.
    • Rarer, massive events show escalation potential: The 1908 Tunguska airburst, estimated at 3–50 megatons, leveled over 2,150 km² of forest, hinting at regional catastrophe without a crater.
    • Monitoring helps but leaves gaps: NASA and ESA track near-Earth objects using scales like Torino and Palermo, while IPCC models highlight climate risks without predicting immediate extinction—yet tail-end uncertainties persist on attribution and high-impact scenarios.

    The Day the Sky Went Loud

    Imagine driving through a quiet Russian morning when the sky ignites. A streak of fire slices the horizon, brighter than the sun. Then comes the boom—windows shatter, glass rains down, people dive for cover. That was Chelyabinsk on February 15, 2013. Dash-cam footage flooded the internet, showing the flash, the delayed shock wave, and the chaos that followed. Injuries from flying debris hit hundreds, a stark reminder of what falls from above.

    Flash back to 1908 in remote Siberia. Eyewitnesses described a fireball howling across the sky, followed by detonations that shook the earth. Trees snapped like matchsticks over thousands of square kilometers. No crater, just flattened forest and stories passed down—bright lights, thunderous noise, then eerie silence. These accounts, pulled from transcripts and footage, highlight the sensory overload: the panic, the awe, the questions about what really hit.

    What Witnesses and Analysts Report

    Those on the ground in Chelyabinsk spoke of a blinding light, sonic booms that rattled buildings, and animals fleeing in terror. Similar patterns emerge from Tunguska: fireball sightings, explosive sounds, and widespread damage, gathered from historical records and studies. These aren’t isolated tales; they’re consistent across events, fueling discussions in forums and documentaries.

    Independent researchers point to exotic angles—possible extraterrestrial origins or unexplained fragments for Tunguska. Mainstream analysts stick to asteroid airbursts, but community voices highlight discrepancies in official narratives, drawing on archival materials and witness testimonies. On the climate front, activists push ‘endgame’ warnings of societal collapse, citing tipping points, while IPCC reports focus on severe but not inevitably extinction-level impacts. Both sides have their evidence, shaped by urgency and incentives.

    Timelines, Tracks, and Hard Data

    Dates and numbers anchor these stories. Chelyabinsk struck on February 15, 2013, with an energy release of 400–500 kilotons from a 17–20 meter object. Tunguska hit June 30, 1908, packing 3–50 megatons and flattening 2,150 km². Catalogs from CNEOS and ESA list tens of thousands of near-Earth objects, thousands potentially hazardous. NASA’s Sentry scans 100 years ahead for impacts, using Torino and Palermo scales to rate risks without hype.

    Global catastrophe thresholds start at 1 km objects for widespread damage, scaling to 10 km for mass extinctions, like Chicxulub. IPCC’s AR6 outlines severe climate scenarios with cascading effects, but not near-term human wipeout.

    Date Event Estimated Energy Area/Damage Source
    2013-02-15 Chelyabinsk ~400–500 kilotons TNT Window breaks, injuries JPL/National Geographic/Popova et al.
    1908-06-30 Tunguska ∼3–50 megatons TNT ~2,150 km² flattened Historical summaries/peer literature

    Official Story vs. What the Data Suggests

    NASA’s PDCO and CNEOS monitor actively, funding detection and deflection like the DART mission. They use Sentry and hazard scales to communicate low-probability threats, focusing on >1 km objects while improving small-impactor tech. ESA collaborates, maintaining risk lists for transparency.

    IPCC models severe climate risks—tipping points, ecosystem collapses—but stop short of near-term extinction. ‘Climate endgame’ papers from PNAS and CSER highlight underexplored tails. Chelyabinsk exposed gaps for 10–100 m objects: they slip through detection, causing local havoc. Agencies temper messaging to avoid panic, but communities see this as downplaying real uncertainties in tails and societal collapse paths.

    Where Data Ends and Mystery Begins

    Quantifying those low-probability, high-impact tails remains tricky—for asteroids and climate cascades alike. How do tipping points lead to global collapse versus regional fallout? IPCC and others note this as underexplored.

    Tunguska’s thin records fuel debates: tree-fall patterns and fragments spark competing theories. Preparedness for airbursts? Chelyabinsk showed lead times and responses fall short. These aren’t dead ends; they’re frontiers calling for deeper dives, respecting witness accounts and pushing science forward.

    What It All Might Mean

    Evidence points to real risks: Chelyabinsk-style blasts injuring thousands locally, Tunguska-level events devastating regions, and rare kilometer-scale impacts threatening civilization. Climate cascades add layers of severe, interconnected threats.

    Push for better detection surveys, deflection tech, early warnings, and resilience studies. Humility fits here—models offer probabilities, not scripted dooms. Uncertainty on tails and history warrants vigilant, cross-field attention, not quick dismissals.

    Frequently Asked Questions

    Chelyabinsk in 2013 was a meteor airburst that released 400–500 kilotons of energy, causing window damage and injuries captured on videos. Tunguska in 1908 flattened 2,150 km² of forest with 3–50 megatons, based on eyewitness reports and tree patterns.

    NASA and ESA track near-Earth objects using systems like Sentry, with hazard scales like Torino and Palermo to assess risks. They focus on detection and deflection, but gaps remain for smaller objects like Chelyabinsk.

    IPCC reports detail severe cascading impacts from climate change, including tipping points, but not near-term human extinction. ‘Endgame’ research highlights underexplored tail risks leading to potential societal collapse.

    Yes, including quantifying low-probability high-impact events, attributing historical incidents like Tunguska, and mapping climate effects to global collapse. Preparedness for airbursts also shows gaps exposed by Chelyabinsk.