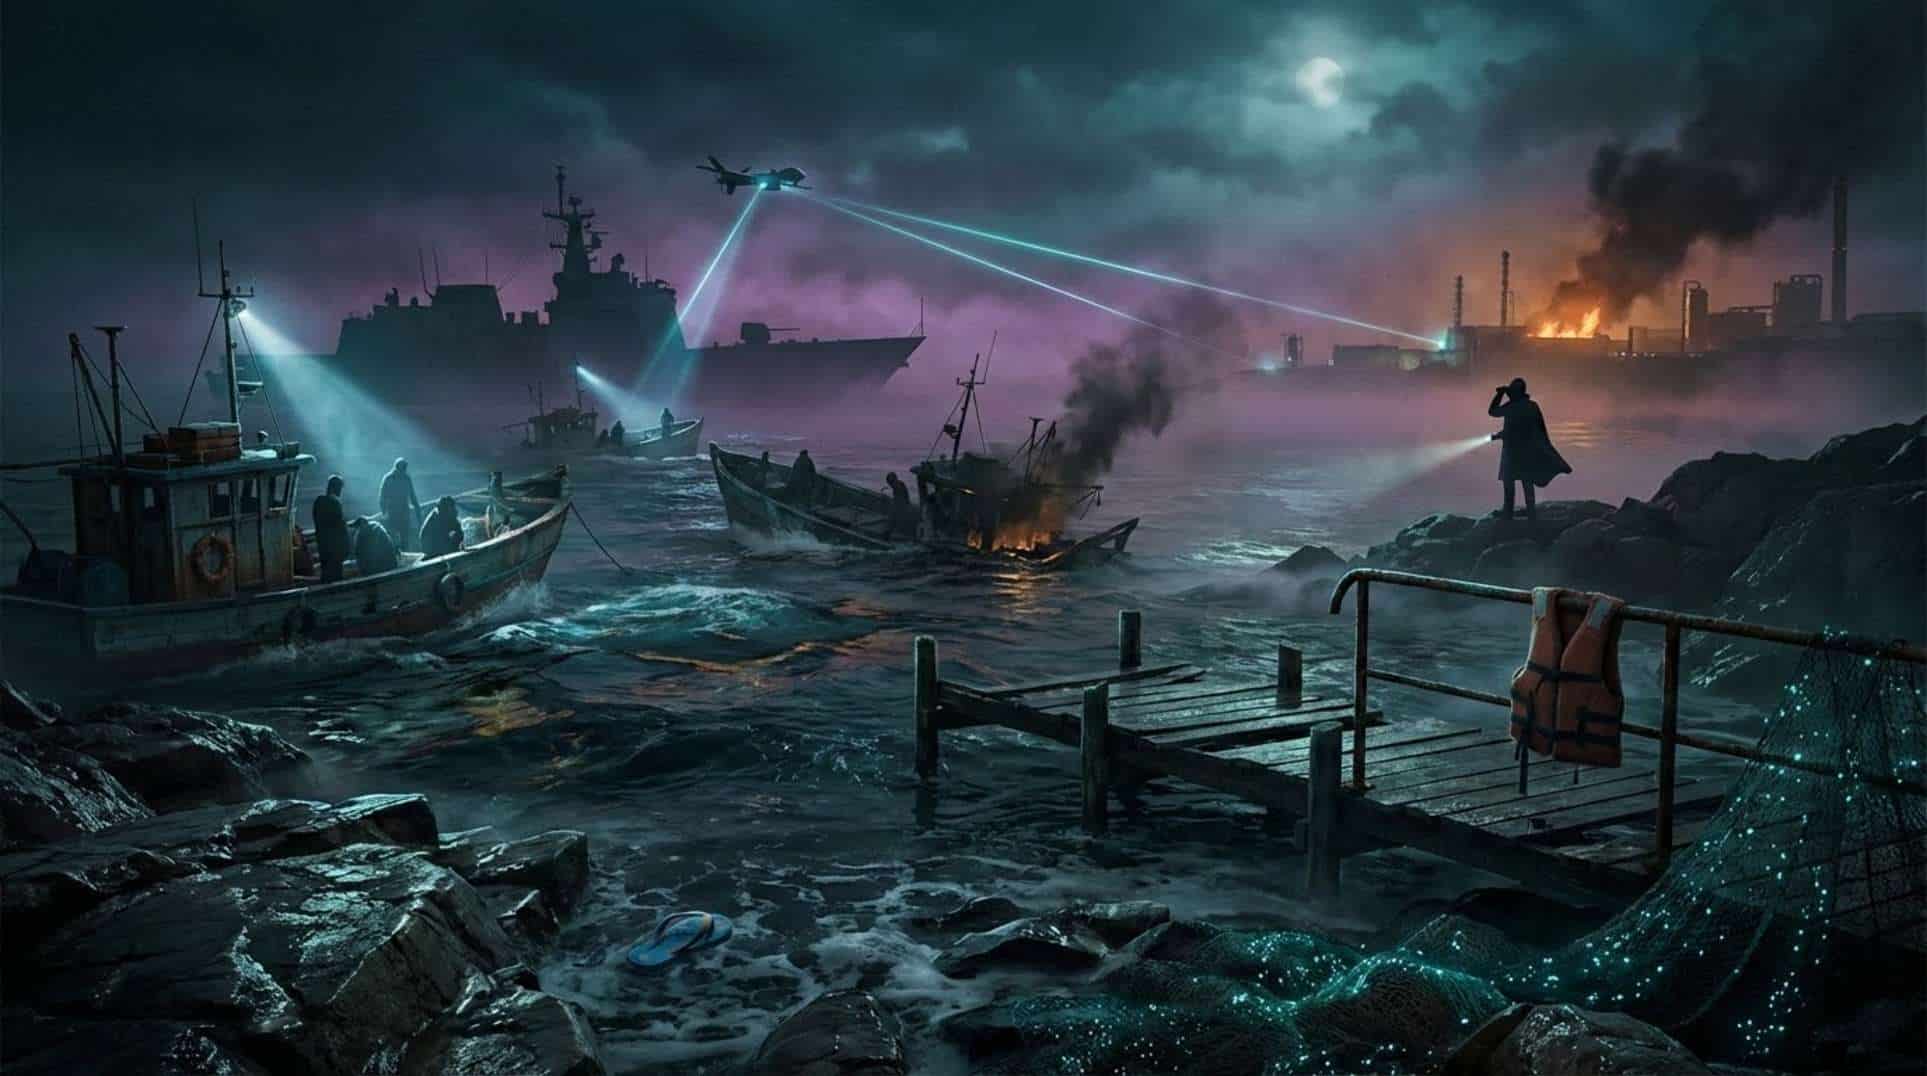
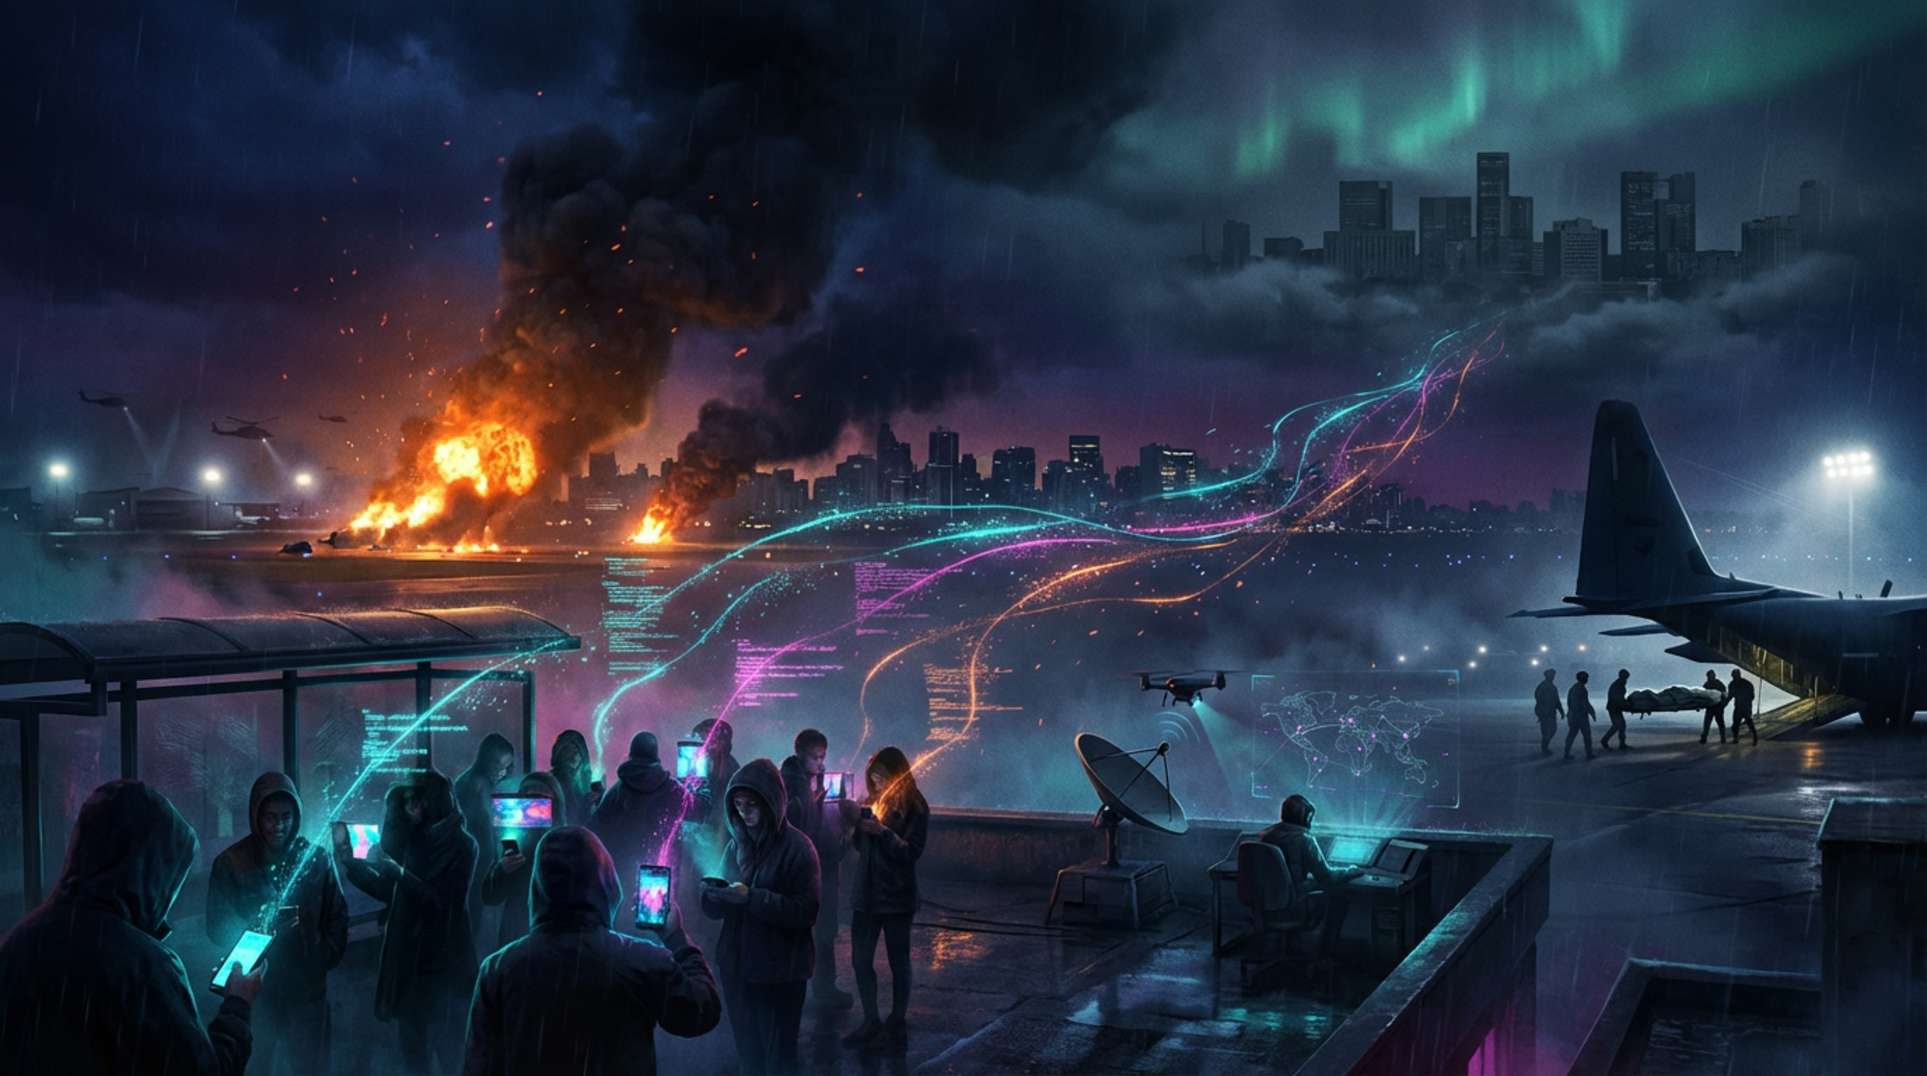
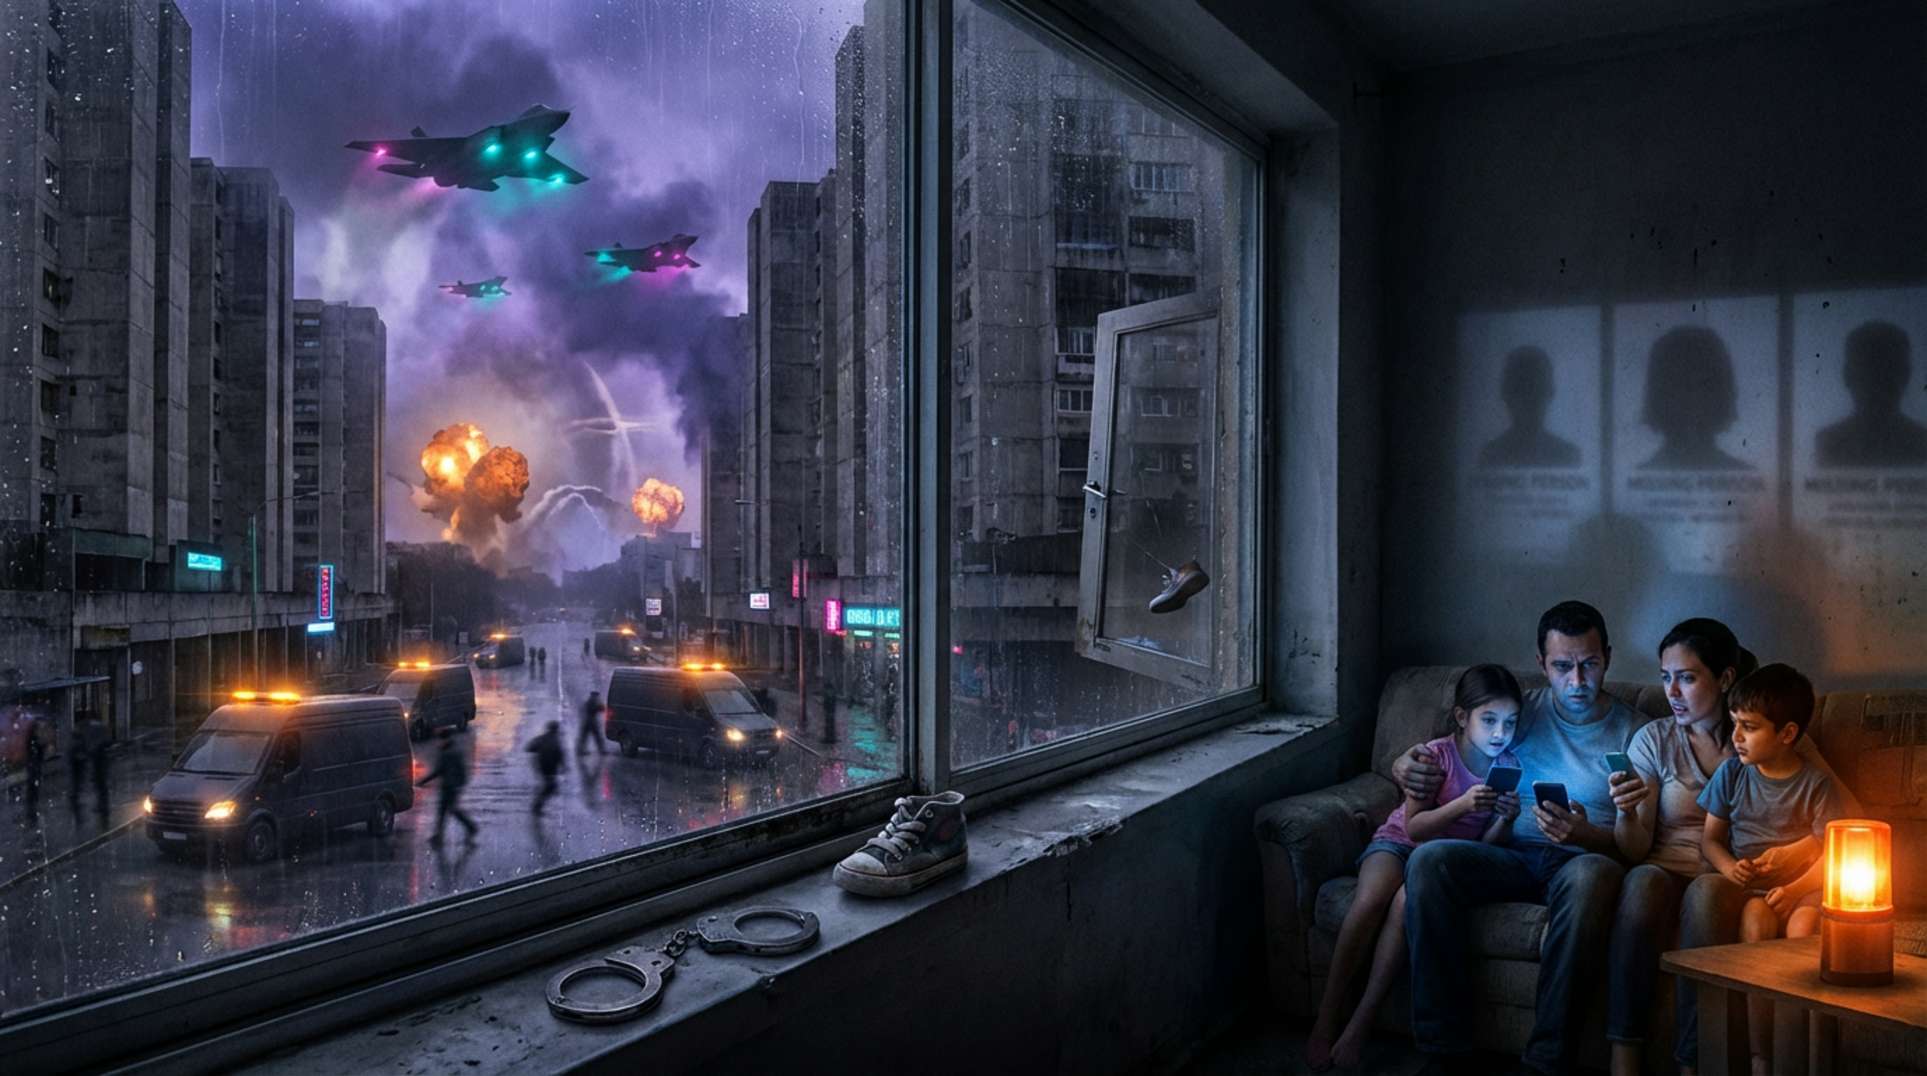
From September 2025, the U.S. carried out maritime strikes on vessels and at least one coastal facility alleged to be carrying drugs from Venezuela; media reported roughly 20–30+ incidents.
Independent reports, survivor accounts, and NGOs have documented civilian deaths and called for investigations, while the U.S. framed actions as counternarcotics operations.
Major gaps remain: limited public evidence for many strikes, disputed victim identities, and questions about legal authorization and geopolitical motives.
Overview
Starting in early September 2025, a series of strikes at sea and on a coastal target were publicly attributed by U.S. officials to disruption of drug shipments linked to Venezuela. Local witnesses, families, and human-rights groups reported deaths and destruction; NGOs and UN officials urged independent inquiries.
Witnesses and Reporting
Media outlets such as AP and BBC reported interviews with relatives and survivors who described many victims as fishers or crew on routine voyages. Independent tallies and NGO investigations estimated casualties ranging from tens to the low hundreds, though figures varied by source.
Legal and Policy Concerns
UN human-rights experts, Human Rights Watch, and Amnesty International raised concerns that some strikes likely violated international human-rights and humanitarian law, citing civilian harm and lack of transparency. Critics argue the U.S. has not released detailed evidence for many strikes, complicating oversight and accountability.
Open Questions
What concrete evidence connects each struck vessel to narcotics shipments?
What legal authorities and rules of engagement authorized lethal strikes in these cases?
Could geopolitical objectives, including pressure on Venezuelan oil-related networks, have influenced the operations?
Conclusion
The reported campaign beginning September 2025 drew significant international scrutiny and calls for independent investigation. With a UN fact-finding process announced in late 2025, further transparency and forensic work will be essential to resolve contested claims and address accountability for civilians harmed.
Many viral “underwater structure” claims come from low-resolution public maps that can produce geometric illusions or interpolation artifacts rather than real constructions.
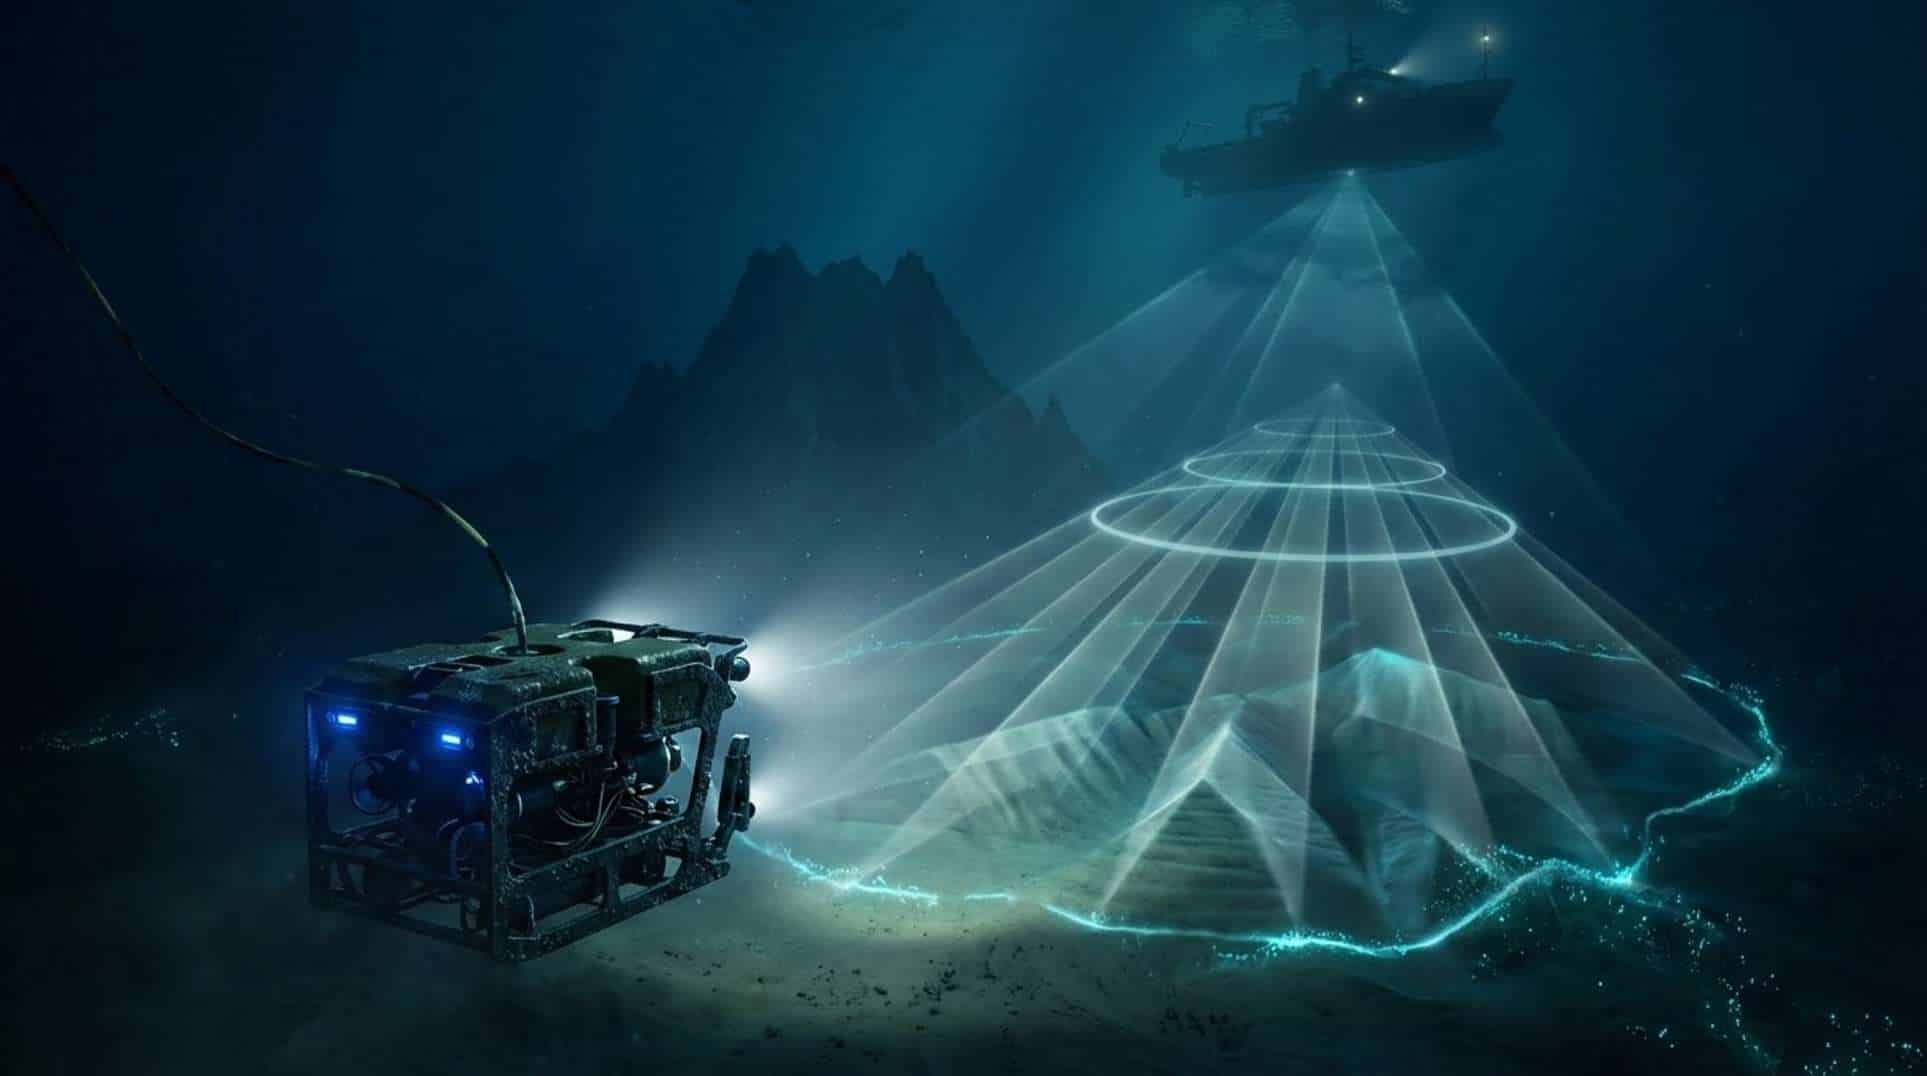
Modern multibeam surveys provide high-resolution, verifiable bathymetry, but as of Seabed 2030’s 2024 reporting only roughly 26.1% of the seafloor has been mapped to those standards—leaving large areas reliant on coarser satellite gravity data.
Some dramatic features discovered by multibeam (for example, tall seamounts) are genuine; other alleged structures lack multibeam or visual ground-truth and remain unresolved.
A Silent Convoy Beneath the Dark Sea
Vast stretches of the ocean floor remain poorly charted. When coarse grids are visualized with hillshading, they can suggest walls, pyramids, or other orderly shapes. Occasionally surveys reveal true surprises—seamounts and canyons that were previously unknown. The 2005 USS San Francisco collision with an uncharted seamount is a reminder that mapping gaps have real consequences.
What Witnesses and Analysts Report
Community researchers and content creators frequently post coordinates and annotated screenshots from public layers (GEBCO, ETOPO). These posts often mix data types and use visual shading that amplifies perceived geometry. Skeptics point to pareidolia and dataset artifacts; proponents push for follow-up surveys and ROV inspection. Both sides are limited by available data and funding for verification.
Timelines, Tracks, and Hard Data
Seabed 2030 coordinates a global effort to map the seafloor by decade’s end and reported about 26.1% coverage to modern multibeam standards in 2024. Large additions to the global grid occur when research vessels and institutions release multibeam surveys—the Schmidt Ocean Institute and national hydrographic offices regularly publish such data. In many regions, however, bathymetry is inferred from satellite gravity at resolutions on the order of kilometers, which can create interpolation artifacts not present in true sonar scans.
Official Story vs. Community Interpretations
Organizations like GEBCO and NOAA emphasize the difference between directly measured multibeam bathymetry and gravity-derived interpolations. Official archives and metadata can usually tell you whether a feature is supported by multibeam data or is gravity-inferred. Fact-checks frequently find that viral claims rely on the coarser layers; conversely, when multibeam is present it often reveals natural geological processes rather than artificial structures.
What It All Might Mean
Improving bathymetric coverage is important for navigation safety, scientific discovery, biodiversity assessment, and resource management. While many viral shapes prove to be artifacts, continued mapping will resolve outstanding cases—either confirming interesting geology or closing the book on false positives. Community-led reporting can help prioritize follow-up surveys when coordinates are accompanied by reliable metadata.
How to Verify an Alleged Underwater Structure
Collect the claimed coordinates and any original KMZ/KML or images cited by the claim.
Check the underlying dataset and metadata (GEBCO, NOAA NCEI, national hydrographic offices, Seabed 2030). Determine whether the grid is multibeam-derived or gravity-inferred.
Search for published multibeam surveys, expedition logs, or ROV/video evidence for that area.
If only low-resolution gravity data is present, flag the claim as unverified and annotate likely artifacts (seams, interpolation, coarse shading).
When multibeam supports a feature, seek photographic or sampling ground-truth; absent that, treat interpretations cautiously.
For high-priority cases, contact data-holding institutions or Seabed 2030 to request follow-up, understanding that research-vessel time is limited and costly.
FAQ
What percentage of the seafloor is mapped to modern standards?
Seabed 2030 reported roughly 26.1% coverage by modern multibeam surveys as of 2024; the remainder often relies on satellite gravity-derived models.
Are viral underwater structures real?
Some spectacular features shown by multibeam are real geological formations. Many viral claims, however, arise from low-resolution datasets that produce artifacts. Each claim must be checked against metadata and, ideally, multibeam or visual ground-truth.
What was the USS San Francisco incident?
On January 8, 2005, the USS San Francisco struck an uncharted seamount roughly 364 nautical miles southeast of Guam. The event underscores risks from incomplete bathymetric knowledge.
Date: launches reported on or around 3–4 January 2026 (Reuters / AP).
Time: first detections reported at approximately 7:50 a.m. local time (South Korea JCS / media).
Launch origin: reported as the vicinity of Pyongyang (JCS / Reuters / AP).
Flight metrics: Japan reported at least two missiles reached altitudes of roughly 50 km and flew distances of about 900 km and 950 km (Kyodo / NHK).
Number: described as ‘several’ / ‘multiple’ projectiles; Japan detected at least two (AP / Reuters / Japan Times).
Official posture: INDOPACOM aware and consulting with allies; assessed no immediate threat to U.S. personnel/territory/allies (Reuters citing INDOPACOM).
Community note: commentators (e.g., David Hookstead) flagged an ‘unusual’ or ‘irregular’ trajectory; independent analysts point out North Korea’s history of lofted/variable test profiles and MaRV/hypersonic claims (YouTube / 38 North / Arms Control).
Unresolved core questions: precise trajectory profile (maneuvering vs lofted), weapon-system ID, payload type, and whether detailed telemetry/radar tracks will be released.
A Cold Morning Over the East Sea
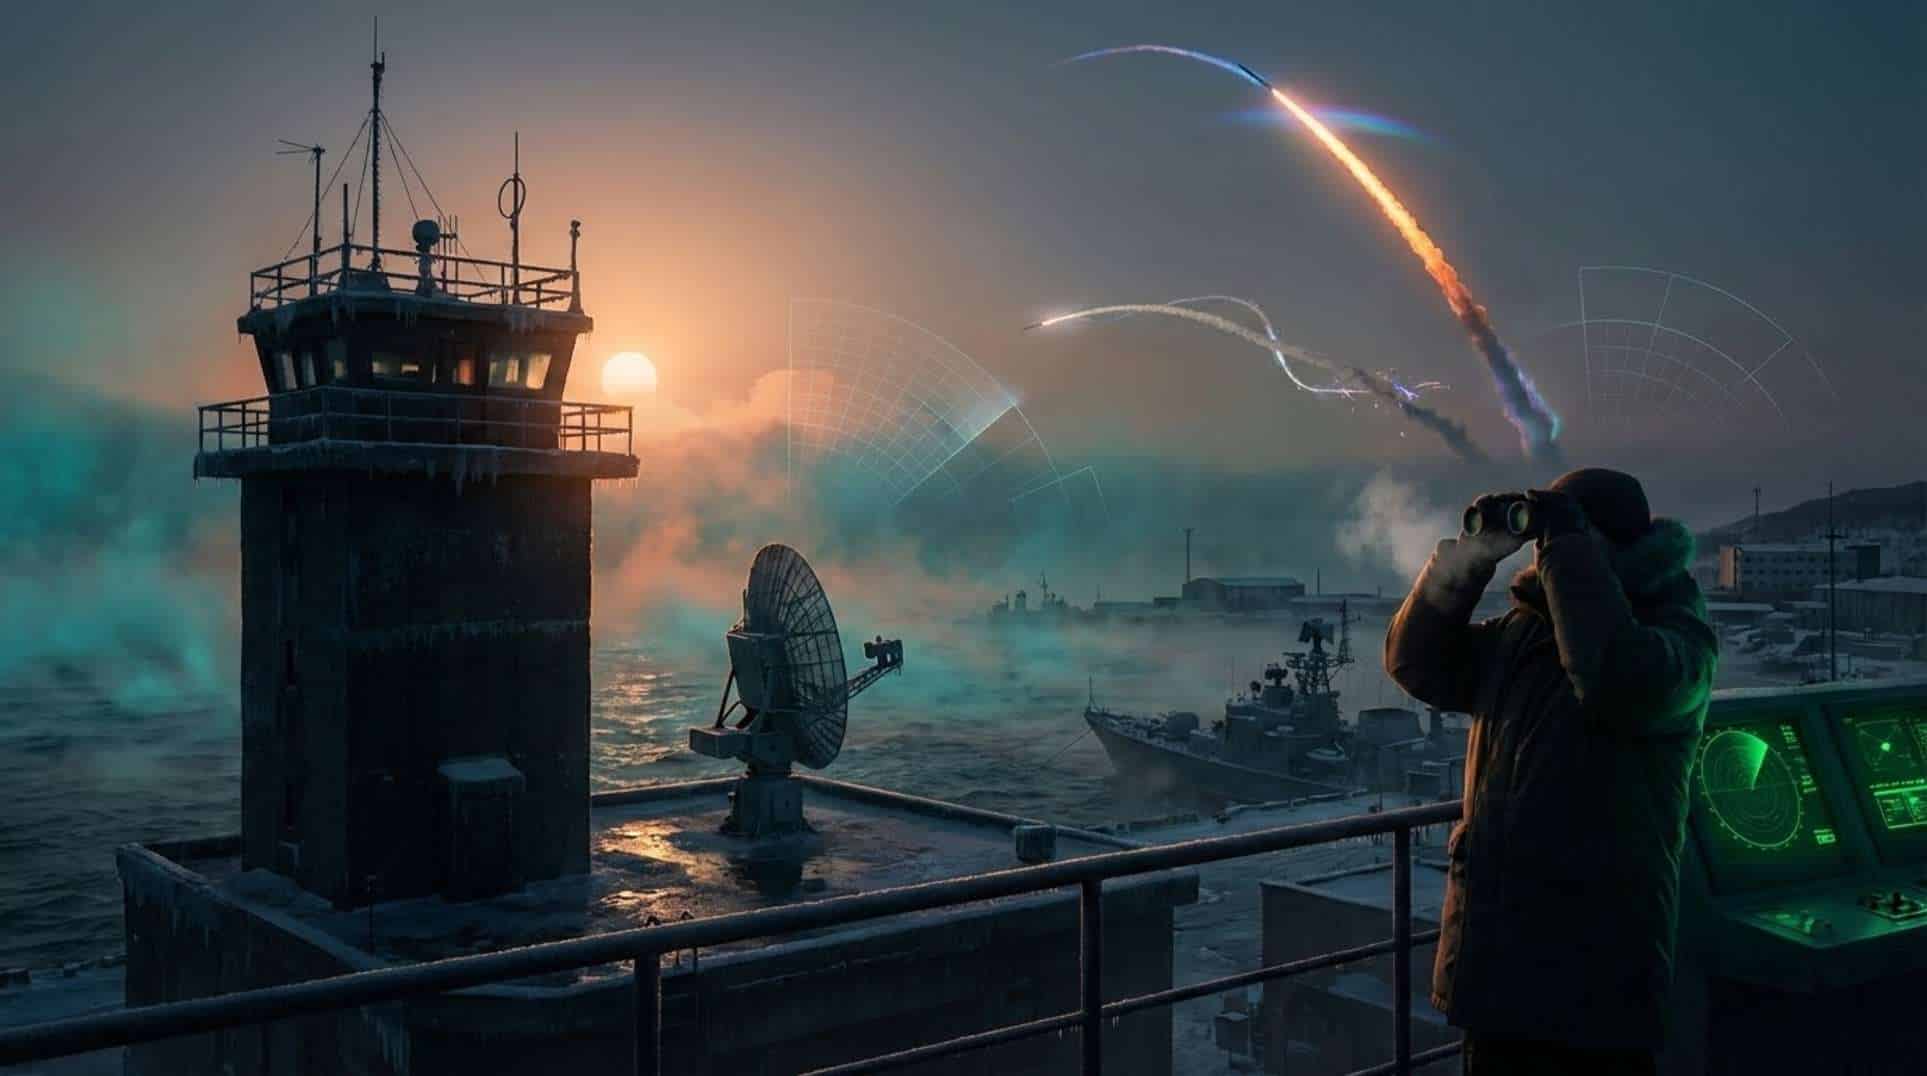
It was an early winter dawn in the region, around 7:50 a.m. on 3–4 January 2026, when the first alerts went out. Missiles lifted off from near Pyongyang, streaking toward the Sea of Japan, also known as the East Sea. The cold air hung heavy, mirroring the tension among those monitoring the skies—regional watchers braced for what might come next.
This timing overlapped with diplomatic stirrings in the area, adding layers to the event. Commentators jumped on reports of an ‘unusual’ trajectory, painting a stark picture: official statements stayed composed, but online discussions buzzed with alarm, as seen in David Hookstead’s video breakdown.
What Witnesses and Analysts Report
South Korea’s Joint Chiefs of Staff detected several ballistic missiles launching from near Pyongyang at about 7:50 a.m., estimating flights around 900 km. Japan’s Defense Ministry confirmed at least two missiles, hitting altitudes of roughly 50 km and covering 900 km and 950 km, prompting a formal protest.
INDOPACOM acknowledged the activity, consulting allies while stating no immediate threat to U.S. personnel, territory, or partners. Independent analysts recall North Korea’s pattern of lofted or variable trajectories for testing reentry or hypersonic claims, drawing from sources like 38 North and the Arms Control Association.
Online communities and commentators, including David Hookstead on YouTube, highlighted the ‘unusual’ flight paths, sparking debates on whether this was technical innovation or political messaging. Keep in mind, initial reports lacked open-source telemetry; data came mainly from national defense systems.
Timelines, Tracks, and Hard Data
Here’s a summary of the key metrics from reliable sources:
Date
Reported Launch Time
Launch Origin
Number of Projectiles
Reported Distances
Reported Apogee
Source
3–4 January 2026
~7:50 a.m. local
Vicinity of Pyongyang
Several/multiple; at least two detected
~900 km (South Korea); ~900 km and ~950 km (Japan)
~50 km
Reuters / AP / Kyodo / NHK / South Korea JCS
INDOPACOM noted awareness and ally consultations, with no immediate threat assessed. Major outlets like The Guardian, Japan Times, CNN, PBS, Al Jazeera, and Bloomberg carried consistent early coverage. Still, no public radar telemetry or space-track data emerged initially, leaving gaps in technical certainty.
Official Story vs. What the Data Suggests
Official accounts from South Korea’s JCS, Japan’s Ministry of Defense, and INDOPACOM focus on confirmed launches under analysis, stressing no immediate threats: ‘We are aware and consulting with allies,’ as INDOPACOM put it.
Analysts offer varied reads—similar ranges and altitudes could indicate lofted tests for reentry simulation, maneuvering reentry vehicles (MaRVs), or hypersonic elements, but full telemetry is needed for confirmation. Community voices emphasize ‘unusual’ trajectories, echoing North Korea’s history of irregular profiles to test evasion or signal strength, per 38 North and Arms Control Association insights.
The public data—distances, altitudes, times—supports multiple views but doesn’t prove advanced tech without tracks. Motives could range from technical validation to political timing, all fitting the evidence without overstepping it.
What It All Might Mean
We know multiple ballistic missiles launched toward eastern waters on 3–4 January 2026, tracked at 900–950 km with 50 km altitudes by allied monitors. Yet details on trajectories—maneuvering or just lofted—missile types, and telemetry remain unreleased publicly.
If these point to maneuvering or boost-glide tech, they challenge missile defenses; if standard lofted tests, they show ongoing development. Either way, regional security hangs in the balance. Stay tuned for briefings, data releases, or expert analyses that could clarify more.
Frequently Asked Questions
The launches were reported on or around 3–4 January 2026, with first detections at approximately 7:50 a.m. local time.
Commentators like David Hookstead flagged the flight paths as ‘unusual’ or ‘irregular,’ and analysts note North Korea’s history of lofted or variable profiles, potentially for testing reentry or hypersonic capabilities. However, public data doesn’t confirm specifics without telemetry.
INDOPACOM stated they were aware, consulting allies, and assessed no immediate threat to U.S. personnel, territory, or allies. Japan lodged a diplomatic protest, and South Korea’s JCS reported the detections.
If the launches involve advanced maneuvering or hypersonic tech, they could complicate interception efforts. Even if they’re standard tests, they signal continued weapons development with strategic implications.
No widely published open-source telemetry or civilian radar feeds were available in initial reporting. Primary data comes from national defense systems, and releases could provide more clarity.
Many people across cultures report a consistent taboo and set of experiences around whistling at night: hearing a distant whistle, replying, then experiencing a whistle that seems to come closer or answer (documented in USC Digital Folklore Archive, Peabody Museum notes, and contemporary social platforms).
Practical, measurable phenomena can explain a large fraction of reports: nighttime sound propagation (temperature inversions) makes low-frequency sounds travel farther, the NPS warns not to whistle because it can mimic an injured animal and attract predators, and a peer-reviewed PLOS ONE herpetology study (304 trials, 19 snakes) shows snakes can behaviorally respond to airborne sound (responses noted up to ~450 Hz).
Open questions remain: there is no single verified, global ‘supernatural’ mechanism connecting the folklore; cultural expectation and perceptual priming likely shape many reports, and some local traditions (El Silbón, Night Marchers, shape-shifters) preserve genuine mystery that empirical data does not fully resolve.
A Whistle in the Dark
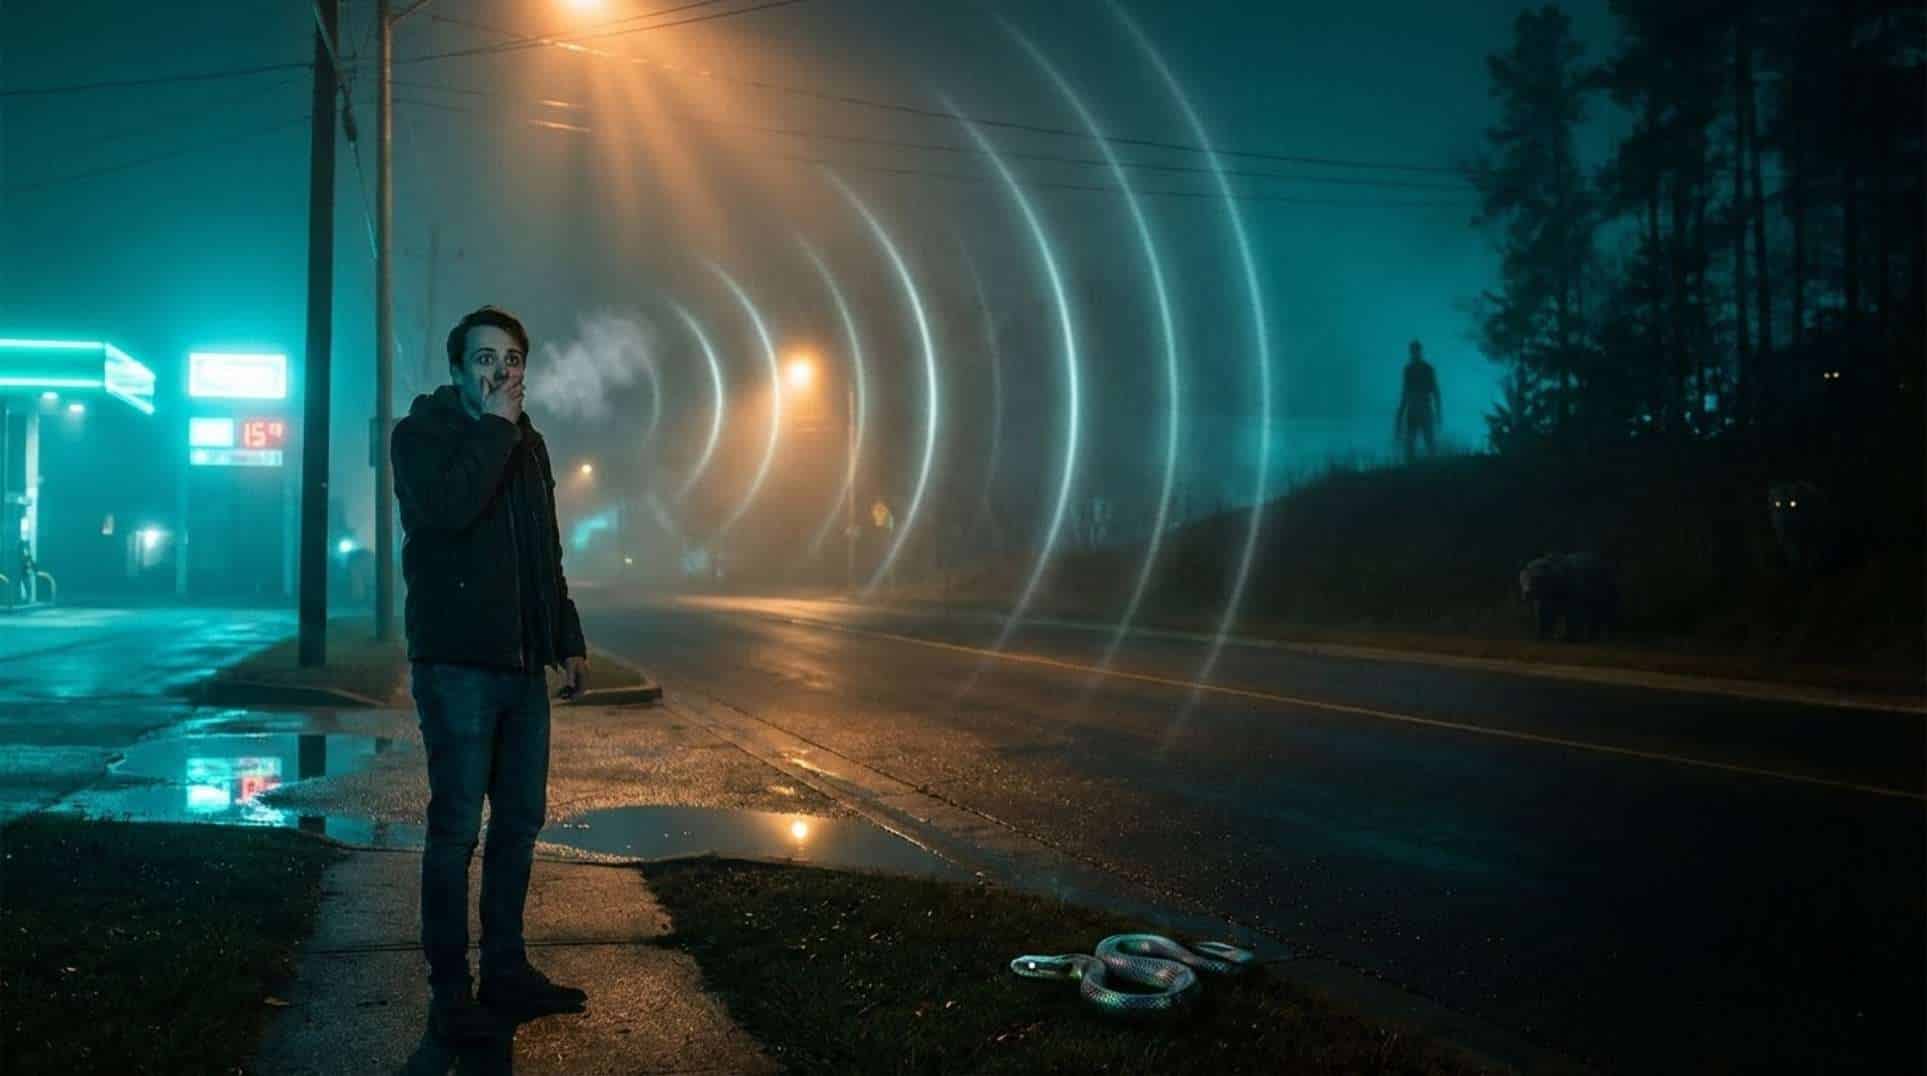
It’s past midnight. The streetlights hum faintly, casting long shadows over empty sidewalks. You’re alone, maybe stepping out for some air, when a sharp whistle cuts through the silence—from somewhere far off, direction unclear. Your pulse quickens. You remember the old stories from your grandmother: “Never whistle back at night. You don’t know what might answer.” Heart pounding, you freeze, straining to listen. According to those who’ve shared similar moments on Reddit and TikTok, that’s when the real fear sets in—the urge to respond, the dread of what comes next. One composite account puts it like this: “I whistled once, just to test it. The reply came closer, like footsteps in the dark. I bolted inside and didn’t sleep till dawn.”
What Witnesses and Analysts Report
Accounts pour in from every corner. People in North and South America, East and Southeast Asia, the Pacific Islands, and parts of Europe all describe the same core warning: don’t whistle at night. The pattern holds steady—a distant whistle with no obvious source, a reply that draws nearer if you answer, and the urgent advice to get inside, stay silent, or build a fire.
These stories often tie to specific figures. In Venezuela and Colombia, it’s El Silbón, a vengeful spirit said to stalk whistlers. Indigenous North American traditions link it to skinwalkers or shape-shifters. Hawaiian accounts mention Night Marchers or Menehune, while spirits in Japan, the Philippines, Africa, and Appalachia carry similar taboos.
Folklore collectors and online communities treat these as shared data. The USC Digital Folklore Archive and Peabody Museum preserve oral histories. On Reddit’s r/Paranormal and BackwoodsCreepy, or in YouTube and TikTok videos, the themes align: fear, retreat, and a sense that something unseen responds. Witnesses speak of emotional weight—paralysis, dread—that lingers long after.
Timelines, Tracks, and Hard Data
Folklore archives like the USC Digital Folklore Archive and Peabody Museum have tracked ‘don’t whistle at night’ traditions for years, spanning communities worldwide. Contemporary reports flood social platforms, echoing these patterns but rarely with outside confirmation.
Science offers anchors. A PLOS ONE study ran 304 trials on 19 snakes from various genera, finding they react to airborne sounds up to about 450 Hz, depending on the species. The National Park Service advises against whistling in bear country—it mimics distress calls and can draw predators; keep 100 yards away. Acoustics explain the reach: temperature inversions at night bend sounds back to earth, letting low frequencies travel farther.
Source
Key Data
PLOS ONE Study
304 trials, 19 snakes; responses to sounds up to ~450 Hz
NPS Bear Guidance
Do not whistle; maintain 100 yd (91 m) safe distance
Atmospheric Acoustics
Temperature inversions enable farther sound travel at night
Official Story vs. What the Data Suggests
Agencies like the NPS keep it practical: make noise to alert wildlife, but skip whistles or screams—they sound like prey in trouble and might pull in bears or other animals. Peer-reviewed work backs this, showing snakes pick up on those frequencies. Physics confirms why sounds carry farther after dark, thanks to stable air layers refracting waves.
Yet communities see more. They frame night whistles as calls to spirits or entities, passed down with rules like ‘don’t answer’ to stay safe. These views endure alongside the science, sometimes blending in.
Animal responses and sound tricks could cover many cases—a far-off whistle bouncing back, or a creature replying. But no field studies fully test this against real anecdotes. Expectation plays a role too, heightening what we hear in the dark. The folklore holds its ground where data falls short.
What It All Might Mean
The taboo shows up solid in archives from USC and Peabody. Experiments on snake hearing and NPS safety tips give real-world reasons to heed it—sounds travel far at night, and animals listen. These pieces fit many reports without invoking the unknown.
Still, questions linger. How many experiences boil down to physics or wildlife versus our own minds? No verified cases prove supernatural harm from a whistle. We need experiments in the field, tracking frequencies and animal reactions under night conditions.
This matters because it shapes actions—people hide, warn kids—and might save lives by steering clear of real dangers. It also keeps cultural stories alive, tying us to fears of the dark. Track these patterns responsibly. Talk to folklorists, biologists, and those who’ve lived it. The mystery doesn’t vanish just because we explain parts of it.
Frequently Asked Questions
Witnesses often report hearing a distant whistle first, then an answering one that seems closer if they reply. This pattern appears in folklore archives and online accounts, tied to fear and advice to retreat indoors.
Yes, nighttime sound propagation via temperature inversions allows whistles to travel farther. Studies show snakes respond to low-frequency sounds, and NPS guidelines warn against whistling to avoid attracting predators like bears.
It ties to practical safety, like avoiding wildlife, but also preserves cultural stories of spirits or entities. Empirical explanations cover many cases, yet perceptual effects and unresolved mysteries keep the traditions alive.
Yes, regional figures include El Silbón in Venezuela and Colombia, skinwalkers in Indigenous North American lore, Night Marchers in Hawaii, and various spirits in Asia, Africa, and Appalachia.
Controlled field studies combining whistle frequencies, night acoustics, and animal behaviors could clarify natural causes. Interviews with folklorists, biologists, and witnesses would help bridge official views and community experiences.
A rare juvenile deep-sea ribbonfish (Trachipterus altivelis) surfaced in Monterey Bay on December 30, 2025, spotted by diver Ted Judah and confirmed by a local aquarium biologist, drawing attention from outlets like SFGATE, SFist, and Divernet.
Mainstream sources, including the USGS and marine institutions, assert no proven link between such strandings or planetary alignments and short-term earthquake prediction; precise forecasting remains impossible.
Independent voices, such as Stefan Burns, point to the sighting alongside global seismicity and planetary configurations as signs of heightened M6+ risk in California—a perspective that’s gaining traction but lacks reproducible evidence for validation.
A Silent Convoy Beneath the Dark Sea
Picture this: December 30, 2025, in the chill depths of Monterey Bay. Diver Ted Judah glides through the murk, his GoPro capturing the endless blue. Then, something long and serpentine cuts through the water—a juvenile deep-sea ribbonfish, Trachipterus altivelis, its body shimmering like a lost relic from the abyss. Judah’s photos and video spread fast in local dive circles, then hit regional news: SFGATE, SFist, Divernet. The sighting stirred echoes of old ocean tales, like the Japanese ‘ryūgū no tsukai,’ the messenger from the dragon palace. Social media lit up with wonder and whispers of omens, pulling in those who’ve long watched the seas for signs of deeper unrest.
What Witnesses and Analysts Report
Ted Judah’s encounter hit hard in the community. His GoPro footage showed the ribbonfish twisting through the bay, a sight that quickly went viral in dive groups and beyond. Regional outlets amplified it, framing the event as a rare glimpse into the deep. For many, it recalled folklore tying these creatures to earthquakes—the ‘doomsday fish’ of Japanese legend, surfacing before disaster. Independent analysts aren’t stopping there. Figures like Stefan Burns weave the sighting into a bigger picture: recent quakes off East Africa, seen as antipodal echoes, plus active planetary alignments. They warn of rising odds for a M6+ event in California. Reactions vary—some stock up on supplies, others demand solid stats to back the claims.
Timelines, Tracks, and Hard Data
Let’s break it down by the numbers. The Monterey Bay event fits into a longer pattern of strandings, with California logging around 20 or more ribbonfish or oarfish sightings since the early 1900s, per media and natural history records. Seismically, the USGS stands firm: no precise predictions possible, only probabilistic maps. Planetary notes include the Saturn-Neptune conjunction building toward February 20, 2026, amid other alignments of Jupiter, Earth, Sun, Mercury, Venus, and Mars—but their tidal pull pales next to the Moon and Sun. Antipodal focusing? It’s a real wave effect in peer-reviewed studies, yet it doesn’t prove quake triggering. Recall the 1989 Loma Prieta M6.9, during a similar Saturn-Neptune phase, which some cite as precedent.
Date
Event
Location
Magnitude/Description
Primary Source
December 30, 2025
Ribbonfish sighting
Monterey Bay, CA
Juvenile Trachipterus altivelis
SFGATE, SFist, Divernet; Monterey Bay Aquarium
Early 1900s–present
Historical strandings
California coast
~20+ recorded cases
Media summaries, natural history
October 17, 1989
Loma Prieta earthquake
San Francisco Bay Area
M6.9
USGS
2025–2026
Saturn-Neptune conjunction
Astronomical
Peak ~Feb 20, 2026
Astronomical references
Recent
Antipodal seismicity
Off East Africa
Claimed patterns
Independent commentators
Official Story vs. What the Data Suggests
The USGS and seismologists hold the line: earthquakes defy short-term prediction, with efforts centered on hazard maps and alerts. Planetary scientists add that alignments like the current ones carry no meaningful gravitational weight against everyday tides. Marine experts at places like the Monterey Bay Aquarium stick to facts—identifying species, not chasing omens. Still, antipodal wave focusing is documented science, hinting at global connections in seismic energy. Where independent claims falter is the synthesis: blending strandings, quakes, and stars into forecasts without shared methods or stats. To bridge that, we’d need open data pulls, like from USGS ComCat, and tests against historical baselines.
What It All Might Mean
The sighting is solid, captured and confirmed. So are the planetary shifts and recent global shakes, plus antipodal effects in the seismic record. But tying them to an imminent California quake? No mechanism holds up yet, and predictions stay anecdotal without rigorous checks. For readers tracking these patterns, it’s worth watching—pull USGS ComCat data for December 2025 to January 2026 to gauge if activity spikes. Evaluate claims with a checklist: Demand reproducible methods, transparent sources, and stats beating random chance. Stay prepared with earthquake kits and plans, probe analysts for their data, and keep that curiosity alive amid the unknowns.
Frequently Asked Questions
Yes, diver Ted Judah encountered a juvenile deep-sea ribbonfish in Monterey Bay on December 30, 2025, with photos and video shared in dive groups. A Monterey Bay Aquarium biologist confirmed the species as Trachipterus altivelis, and it was covered by outlets like SFGATE, SFist, and Divernet.
Mainstream science, including the USGS, finds no proven causal link between ribbonfish strandings or planetary alignments and earthquake prediction. Independent analysts like Stefan Burns suggest patterns with global seismicity and alignments indicate risk, but these claims lack reproducible data and statistical validation.
The USGS maintains that precise short-term earthquake prediction is not possible, focusing instead on probabilistic hazard maps and preparedness. They dismiss links to oarfish sightings or planetary positions, noting negligible gravitational effects from distant planets compared to the Moon and Sun.
Review USGS ComCat data for recent seismicity to see if it’s above baseline. For evaluating predictions, look for reproducible methods, transparent sources, and statistical tests against historical norms—key steps to separate patterns from coincidence.
Hobbyists routinely receive NOAA APT weather images from polar-orbiting satellites using low-cost RTL-SDR dongles, simple antennas, and free decoding software.
NOAA APT downlinks are in the ~137 MHz band (examples: NOAA-15 ~137.62 MHz, NOAA-18 ~137.9125 MHz, NOAA-19 ~137.1 MHz); always verify current frequencies and status on NOAA/NESDIS/OSPO pages.
Optical “lamp-to-lamp” communication (Li-Fi/VLC) appears in experiments but consumer “friendship lamps” generally rely on Wi‑Fi and cloud services rather than direct visible-light links.
Backyard Receivers and What They Capture
With an RTL-SDR dongle (about $20–40), a simple V-dipole or rabbit-ear antenna, and free tools (noaa-apt, MeteorGIS, SDR#), many enthusiasts decode APT audio recordings into visible satellite imagery. Community guides on rtl-sdr.com, Instructables, and YouTube provide step-by-step instructions and shared captures that confirm reproducibility.
Why Quality Varies
Image quality depends on antenna polarization and orientation, pass elevation, local RF noise, and satellite health. Makers often improve reception with modest hardware tweaks (better antennas, low-noise amplifiers) and software settings (bandwidth ~40 kHz, appropriate FM/NFM demodulation).
Optical Communication Experiments
Lab and hobby Li-Fi/VLC projects demonstrate LED-to-photodiode links for short-range data, but reliable long-distance, consumer-grade optical comms remain uncommon. Most off-the-shelf friendship lamps use cloud-based services; converting or building a true line-of-sight optical system requires specialized optics, synchronization, and often significant engineering.
Verification and Tools
To reproduce APT captures: consult current NOAA status pages, obtain TLEs and a pass predictor (n2yo.com, Celestrak), set your SDR to the target frequency with ~40 kHz bandwidth, record the audio, and decode with noaa-apt or equivalent. Cross-referencing timestamps with predicted passes helps attribute images to specific satellites.
Legal and Privacy Notes
Receiving publicly broadcast NOAA signals is permitted; transmitting on regulated RF bands or using powerful optical transmitters can be restricted by local rules—check regulations before transmitting. Privacy trade-offs differ: cloud-dependent devices expose metadata to service providers, while DIY optical or RF systems shift control to users but increase technical and regulatory responsibilities.
Next Steps for Curious Makers
Try a basic APT capture (RTL-SDR dongle, simple antenna, and noaa-apt) timed to a predicted pass. If exploring optical links, start with short-range LED/photodiode experiments and document results. Share timestamps, configurations, and raw captures so others can reproduce and help validate findings.
Frequently Asked Questions
Can I decode NOAA images with cheap gear? Yes. Many hobbyists do so with inexpensive RTL-SDR dongles, simple antennas, and free software; follow community tutorials to get started.
Do friendship lamps work without the internet? Most commercial devices use Wi‑Fi/cloud. True direct optical communication is possible in experiments but not typical of consumer friendship lamps.
How do I verify active NOAA satellites? Check NOAA/NESDIS/OSPO status pages for current operational satellites and frequencies, and use TLE-based predictors to correlate decoded images with satellite passes.
U.S. forces carried out strikes in Venezuela on or around 3 January 2026, with the U.S. announcing President Nicolás Maduro’s capture and transport to the United States, as reported by multiple mainstream outlets.
Preliminary Venezuelan tallies reported at least 40 dead in the strikes; eyewitness and local reports describe explosions in Caracas, smoke at La Carlota airfield, and activity at military bases.
Viral social-media claims and a widely circulated YouTube alert alleging a Moscow blackout, bombardment, and nuclear emergency remain uncorroborated by institutional sources; the IAEA is monitoring developments near Russian nuclear sites but has not confirmed any nuclear release or attack.
The Night the Alerts Exploded
Picture Caracas in the dead of night on 3 January 2026. Explosions rip through the air, lighting up the skyline. Eyewitnesses report blasts shaking buildings, smoke rising from La Carlota airfield and nearby military sites like Fuerte Tiuna. Phones buzz nonstop—people huddle over screens, refreshing feeds as news of U.S. strikes and Maduro’s capture spreads like wildfire.
Then the alerts escalate. Telegram threads light up with frantic shares. A viral YouTube video screams ‘⚡ALERT: Maduro and RUSSIA/ CHINA Nuclear EMERGENCY! WW3 RISK ELEVATED, Moscow UNDER ATTACK!’ Claims pour in: blackouts in Moscow, sounds of bombardment, whispers of a nuclear edge. Confusion reigns. Fear grips the diaspora, anger boils among analysts seeing this as a bold signal to Russia and China. Shares multiply, each one amplifying the dread.
What Witnesses and Analysts Report
Eyewitnesses in Venezuela paint a vivid picture. Local outlets and on-the-ground accounts detail explosions rocking Caracas, with thick smoke billowing from La Carlota and other military spots. Vice-President Delcy Rodríguez steps forward, demanding ‘proof of life’ for Maduro amid the chaos.
Diaspora voices and geopolitical analysts weigh in, framing the U.S. move as a calculated jab that might draw fire from Russia or China. They point to patterns in global tensions, suggesting this could provoke a fierce reply.
Meanwhile, independent channels and Telegram threads buzz with reports of Moscow under siege—blackouts, alleged bombardments, even escalations to a full nuclear emergency. Footage circulates, claims stack up, tying into WW3 fears. These are reports from witnesses, analysts, and social feeds—their credibility spans a wide range, and many await independent checks.
Timelines, Tracks, and Hard Data
Let’s break down what we can pin down from institutional sources. The strikes hit on 3 January 2026, with reports spilling into the next day. Venezuelan officials tallied at least 40 dead, a mix of civilians and soldiers, as shared with outlets like The New York Times.
U.S. statements confirmed the operation and Maduro’s capture, transporting him stateside. Mainstream coverage from Reuters, NYT, CBS, and The Guardian echoed this, alongside diplomatic ripples. The IAEA stepped in, monitoring military moves near Russian nuclear sites like Kursk, warning of risks but confirming no nuclear incidents.
That viral YouTube video and social posts pushed Moscow blackout and attack claims, but nothing from IAEA, Rosatom, or independent networks backs them up yet.
Date/Time
Reported Event
Source
3 January 2026
U.S. strikes in Venezuela; claim of Maduro’s capture
Multiple outlets (e.g., The New York Times)
3-4 January 2026
Preliminary report of at least 40 dead
Venezuelan tallies via The New York Times
3-4 January 2026
U.S. announcement of Maduro in custody
U.S. government statements
Ongoing as of 4 January 2026
IAEA monitoring near Russian nuclear sites (e.g., Kursk NPP)
IAEA Director General statement
3-4 January 2026
Viral claims of Moscow attack/nuclear emergency
Social media (YouTube, Telegram); uncorroborated
Official Story vs. What the Data Suggests
The U.S. lays it out plain: an operation in Venezuela snagged Maduro, now in their custody, as broadcast through mainstream channels. Russia and China fire back hard—condemnations, calls for UN Security Council huddles, even nuclear-tinged rhetoric from Russian corners, all logged by Reuters and others.
The IAEA holds steady, tracking sites and flagging dangers from nearby military action, but they stop short of confirming any detonation or release in Moscow.
Community takes run a different track. YouTube and Telegram amplify attack narratives on Moscow, blending real elements like Russian statements with unverified clips. Data points to gaps here—no official nods to a nuclear event, shaky authentication on videos, chains of custody in question. These holes let alternative views thrive, where official lines leave room for doubt.
What It All Might Mean
Sticking to what’s solid: U.S. strikes hit Venezuela around 3 January 2026, capturing Maduro per their claim, with at least 40 reported dead on the ground. Russia and China condemned it sharply, pushing for UN talks, while the IAEA monitors nuclear sites like Kursk without confirming crises.
Yet the unconfirmed pieces loom large—no verification on Moscow blackouts, bombardments, or any nuclear release from bodies like IAEA or Rosatom.
Questions linger: Can we verify Moscow claims through on-site reports, satellites, or grid data? What do IAEA radiation checks show? How solid are the capture images? Escalation risks are real—misinfo can fan flames fast. Readers, cross-check with IAEA updates, Rosatom feeds, and trusted monitors. We’ll chase ground sources, satellite traces, and diplomatic wires for clarity. Hold steady; patterns emerge with patience.
Frequently Asked Questions
U.S. forces conducted strikes in Venezuela, resulting in explosions in Caracas and smoke at sites like La Carlota airfield. The U.S. announced the capture of President Nicolás Maduro, who was transported to the United States, with preliminary reports indicating at least 40 deaths.
Viral social media posts and a YouTube video alleged blackouts, bombardment, and a nuclear emergency in Moscow, but these remain uncorroborated. The IAEA is monitoring Russian nuclear sites like Kursk and has not confirmed any nuclear release or attack.
Russia and China strongly condemned the strikes and capture, demanding UN Security Council meetings. Some Russian figures used nuclear-threatening language in their rhetoric, as reported by outlets like Reuters.
Key uncertainties include independent verification of any Moscow blackout or attack, IAEA radiation readings from nuclear sites, authentication of images related to Maduro’s capture, and potential escalation thresholds in diplomatic or military responses.
The strongest evidence points to geomagnetic storms being driven mainly by solar wind variations, coronal mass ejections, and high-speed solar wind streams, tracked through indices like Kp and Dst by agencies such as NOAA’s Space Weather Prediction Center.
Plausible alternative readings highlight discrete events like the Starfish Prime nuclear test on July 9, 1962, which injected artificial radiation belts, damaged satellites, and triggered visible auroras, yet these were human-made and not shown to alter Earth’s core geodynamo.
Crucial unresolved questions include whether multi-decadal rises in storm counts stem from actual solar activity or from biases in observation networks, and if 20th-century nuclear testing truly caused permanent changes to the planet’s deep magnetic field—links that remain unproven and require further scrutiny.
A Silent Convoy Beneath the Dark Sky
Imagine the night sky igniting without warning. Auroras dance where they shouldn’t, radios hiss with static, and instruments spike in ways that make the ground feel alive. Witnesses describe power glitches and an eerie hum, as if the planet itself is protesting. These moments pull communities together, sharing footage and plots online, linking them to space-weather alerts that feel too timely to ignore.
Community voices like Stefan Burns highlight these spikes in Kp and Dst indices, tying them to local oddities—flickering lights, unexpected northern lights. History echoes this: during Starfish Prime, observers saw artificial auroras and blackouts, with satellite failures lingering for months, as noted in Spaceweather and National Geographic accounts.
Agencies like NOAA’s SWPC offer near-real-time nowcasts and historical data, letting anyone cross-check those vivid auroras against official timelines. It’s this blend of personal experience and verifiable traces that makes the topic burn with urgency for those who’ve felt the disruptions firsthand.
What Witnesses and Analysts Report
Across social platforms and YouTube channels, independent researchers share magnetometer graphs blended with personal stories—unusual auroras, strange electromagnetic sensations that hit during storm peaks. Figures like Stefan Burns distribute these reports, building a picture of patterns that demand attention.
Community claims often point to a rise in geomagnetic storm frequency through the 20th century, with intriguing overlaps between intense solar or geomagnetic events and major earthquakes. Many argue that nuclear testing reshaped Earth’s near-space environment, creating a legacy of instability.
Yet within these circles, skeptical analysts push back, warning against mistaking correlation for cause. They call for rigorous statistical checks to separate genuine shifts from coincidental alignments, ensuring claims hold up under scrutiny.
Timelines, Tracks, and Hard Data
The Planetary Kp index, measuring global geomagnetic activity every three hours, stretches back to 1932, with archives maintained by NOAA’s SWPC and NCEI for easy downloads of Kp and Dst data. Peer-reviewed work ties storm patterns tightly to the 11-year solar cycle, though models of extremes draw from relatively short multi-decadal records, as seen in studies from Space Weather (Reyes et al., 2021) and Earth, Planets and Space (2020).
Starfish Prime stands out: on July 9, 1962, this 1.4-megaton blast at about 400 km altitude injected roughly 10^29 energetic electrons, spawning artificial radiation belts that harmed satellites and sparked auroras, per NASA, OSTI, CTBTO, and National Geographic sources.
For context, extreme Dst events include the -640 nT drop on March 13, 1989, a intense space-age storm, while the 1859 Carrington event is estimated at -1760 nT, hinting at broader historical scales. Nuclear testing tallied around 1,900 global detonations in the 20th century, with high-altitude blasts causing transient disturbances via EMP and ionospheric heating, as detailed in Glasstone & Dolan and GlobalSecurity reports.
Metric/Event
Details
Date/Availability
Kp/Dst Indices
Global geomagnetic activity tracking
Available from 1932 (Kp)
Starfish Prime
1.4 megatons at ~400 km
July 9, 1962
Major Solar Storm
Dst = -640 nT
March 13, 1989
Carrington Event Estimate
Dst ≈ -1760 nT
1859
Readers can extract Kp/Dst time-series from 1932 onward and plot storm counts against sunspot numbers to assess how 20th-century trends align with solar activity or observational shifts. This hands-on approach reveals overlaps and gaps that new analysis could fill.
Official Story vs. What the Data Suggests
According to NOAA’s SWPC, geomagnetic storms arise from solar wind, CMEs, and high-speed streams, quantified through Kp and Dst for infrastructure alerts—their standard position on the drivers behind these events.
NASA and peer-reviewed papers confirm high-altitude tests like Starfish Prime temporarily reshaped near-Earth space, creating artificial belts and satellite issues, but they find no proof of impacts on the deep geodynamo in Earth’s core, as per NEPP and OSTI documents.
Geomagnetism experts stress the patchy nature of pre-mid-20th-century data, suggesting apparent long-term increases might stem from better monitoring, index tweaks, or natural geomagnetic drifts rather than human interference.
Community analysts, however, see mid-20th-century storm rises syncing with nuclear testing eras as potential evidence of lasting disruption—a view that hinges on teasing apart effects through quantitative methods. The gap lies in replicable stats that isolate anthropogenic marks from solar noise, leaving room for deeper probes.
What It All Might Mean
Solar activity clearly dominates geomagnetic storm patterns, with events like Starfish Prime delivering sharp, documented jolts to near-Earth space without enduring core changes.
Still, uncertainties linger: how much do observational improvements skew 20th-century trends? Is there a solid tie between space weather and earthquakes? And have human actions touched the geodynamo? Current studies and defense reports see no such evidence.
To advance, consider plotting Kp/Dst trends against sunspots, compiling bibliographies on man-made injections, or speaking with geomagnetism specialists about biases and nuclear fingerprints. This matters because it weaves personal stories with nuclear history, risks to grids and satellites, and scientific unknowns—demanding precise reporting to cut through the fog.
Frequently Asked Questions
Geomagnetic storms are mainly driven by solar wind variations, coronal mass ejections, and high-speed solar wind streams, as monitored by indices like Kp and Dst from NOAA’s SWPC.
High-altitude tests such as Starfish Prime created temporary artificial radiation belts, damaged satellites, and caused auroras, but no established evidence shows they changed the deep geodynamo in Earth’s core, according to NASA and peer-reviewed literature.
Community reports suggest rises linked to nuclear testing and patterns with earthquakes, but skeptics point to potential biases from improved observations and index changes, calling for statistical analysis to confirm any real trends beyond solar cycles.
Access archives from NOAA’s SWPC and NCEI for Kp and Dst indices dating back to 1932, then plot storm counts against sunspot numbers to check alignments with solar activity or observational shifts.
Storms can lead to power glitches, satellite failures, and infrastructure disruptions, as seen in historical events like Starfish Prime and major solar storms, highlighting vulnerabilities in grids and transportation.
The disputed July 2024 presidential election in Venezuela sparked widespread protests, followed by a crackdown with thousands of arrests, as documented by NGOs like Foro Penal (1,848 verified from July to September 2024) and cumulative tallies nearing 2,062 by year’s end; UN reports highlight a systemic breakdown in rule of law, with patterns suggesting political persecution.
Based on consistent reporting from the UN Fact-Finding Mission and groups like Human Rights Watch, mass detentions, enforced disappearances, and due-process violations appear widespread and ongoing, compounded by government prisoner releases in late 2025 that NGOs say fall short, leaving hundreds still held.
Open questions linger around the January 3, 2026, events—reports of U.S. strikes on Caracas and Maduro’s possible capture lack independent verification, including chain of custody and legal basis, while gaps persist in full detainee counts and judicial transparency.
Midnight in Caracas: The Night Explosions Shook the City
It’s just after midnight on January 3, 2026, and the air in Caracas thickens with tension. Residents jolt awake to the rumble of low-flying aircraft slicing through the night sky, followed by sharp explosions that echo off concrete towers. Families huddle in dim living rooms, phones buzzing with frantic messages—checking on loved ones already caught in the post-election dragnet, scrolling live feeds for scraps of news. This isn’t some isolated incident; it’s the culmination of months of unrest since the disputed July 2024 vote, where protests met swift security sweeps, detentions, and whispers of vanishings. Social media erupts in real time, Venezuelans abroad torn between outrage over sovereignty and quiet hope for change. We’ve all tracked aerial anomalies before—those unexplained lights or crafts that defy easy answers. Here, the reports from Reuters, CBC, and Radio-Canada point to U.S. strikes, but the full picture? That’s what we’re digging into next.
What Witnesses and Analysts Are Saying
From the ground up, the stories align in haunting ways. Victims and families describe sudden arrests sweeping through neighborhoods after the July 28, 2024, election—doors kicked in, people bundled into vans, then silence. NGOs like Foro Penal have been logging these cases daily, verifying 1,848 arrests between late July and September 2024 alone. Human Rights Watch echoes this with dozens of testimonies: killings, enforced disappearances, arbitrary holds in counter-terrorism courts where access to lawyers is a rarity. Families struggle to locate detainees, echoing UN reports of incommunicado periods that fit patterns of disappearance.
Local researchers and opposition groups add layers, sharing alleged vote discrepancies from election tallies that fuel the distrust. Communities aren’t buying the official line; they’re piecing together their own narratives, much like how our readers analyze sighting data. Diaspora networks in Canada, the U.S., and Latin America amplify these voices online—emotional, polarized, but grounded in shared experiences. We cross-check where we can: HRW’s cumulative arrest count hits around 2,062 by December 2024, drawing from Foro Penal’s meticulous records. These aren’t isolated claims; they form a pattern we’ve seen in other shadowy operations.
Timelines, Tracks, and the Hard Data
To cut through the fog, let’s map this out forensically. Key events overlap in ways that demand scrutiny, from election day chaos to that explosive night in 2026. Sources range from UN missions to NGO tallies, with verification statuses noted—some rock-solid, others hanging on threads. Here’s a compact timeline to help you track it:
Date
Event
Source
Verification Status
28 July 2024
Disputed presidential election; onset of protests and mass arrests.
Foro Penal, HRW
Verified
28 July–30 Sept 2024
1,848 verified arrests.
Foro Penal
Verified
Sept 2023–Aug 2024
UN FFM report documents rule-of-law degradation.
OHCHR/FFM
Verified
Through 31 Dec 2024
Cumulative arrests ~2,062.
HRW citing Foro Penal
Verified
March 2025
FFM updates on political persecution patterns.
FFMV
Verified
30 Apr 2025
HRW report on post-election killings, disappearances, detentions.
Human Rights Watch
Verified
16 Aug 2024 & 9 Sept 2024
Canada statements urging result verification and detainee release.
Global Affairs Canada
Verified
Late Dec 2025 / Jan 2026
Government announces 88–99 prisoner releases; NGOs dispute totals.
Reports of U.S. strikes on Caracas and Maduro capture.
Reuters, CBC, CTV, Radio-Canada
Unverified
Official Narratives vs. What the Data Points To
The Venezuelan government paints detainees as terrorists, justifying sweeps as necessary security measures and dismissing outside critiques as interference—any strikes? Pure imperialism. Yet UN Fact-Finding Mission reports clash hard, outlining arbitrary arrests, torture allegations, and disappearances that scream political targeting, even rising to crimes against humanity levels.
Canada’s statements—from August 2024 calls for transparent results to September demands for releases—highlight the international pushback, urging adherence to law post-2026 reports. Take the prisoner releases: officials claim 88–99 freed in late 2025, but NGOs insist hundreds remain, a stark mismatch. On the January 3 operation, media outlets reported strikes and a possible Maduro takedown, but without confirmed custody chains or legal backing, it smells like classic black ops ambiguity. The government’s counter-terror frame might cloak political motives, while sanctions and fact-finding efforts sketch paths to accountability. Data suggests the official story bends under scrutiny.
What This Could All Add Up To
We’ve got solid ground here: UN and NGO docs confirm repression scaling up post-July 2024, with arrests, vanishings, and justice gaps stretching back to 2023. Likely elements include the true scope of detentions—some potentially permanent—and the murky legality of that 2026 strike, where releases don’t match NGO counts.
Big questions hang: Who can independently verify high-profile custodies or judicial charges? What’s the legal footing for foreign actions, and how does it ripple regionally? Next moves: Pull case files from Foro Penal families, chase FFM updates, ping Global Affairs Canada, HRW, and even Venezuelan officials. Seek satellite shots, radar logs, consular notes—tools we’ve used on aerial mysteries before. This matters for Venezuelans facing erased voices, for a region eyeing intervention precedents, and for anyone championing rule of law against shadowy power plays. Victims’ accounts drive this; uncertainties flag where we keep probing, respecting the narratives that push us forward.
Frequently Asked Questions
The disputed presidential election on July 28, 2024, led to widespread protests, which the government met with security operations resulting in mass arrests and detentions, as documented by NGOs and UN reports.
Foro Penal verified 1,848 arrests from July 28 to September 30, 2024, with cumulative figures reaching around 2,062 by December 2024 according to Human Rights Watch citing Foro Penal. These tallies come from daily family reports and cross-checks, making them credible but subject to ongoing verification.
Multiple outlets like Reuters and CBC reported explosions, low-flying aircraft, and claims of U.S. strikes leading to Maduro’s possible capture on January 3, 2026. However, independent verification of the operation, chain of custody, and legal basis remains unresolved.
The Venezuelan government frames detentions as anti-terror measures and dismisses foreign involvement as interference, while UN and NGO findings document arbitrary arrests, disappearances, and political persecution, highlighting major discrepancies in narratives and numbers.
It raises questions about accountability in contested elections, humanitarian access amid repression, and the implications of potential foreign military actions, setting precedents for regional politics and rule-of-law advocacy.
A planned ‘second post-midnight moment’ unfolded in Times Square on New Year’s Eve 2026, where America250 and the Times Square Alliance relit the Ball in red, white, and blue at around 12:04 a.m. EST to kick off the Semiquincentennial, backed by official press releases from Times Square and America250.
The event was broadcast live by major networks and the official Times Square webcast, drawing an on-site crowd of about 1 million and a global TV/streaming audience estimated from hundreds of millions to roughly 1 billion, according to sources like People, CBS, NYT, and Times Square listings.
Key gaps persist: the specific viral video claiming ‘disturbing ancient propaganda’ remains unlocated in mainstream searches, and production credits for the segment’s imagery lack public documentation—calling for frame-by-frame analysis and vendor identification to resolve these questions.
Midnight, Confetti, and a Second Light
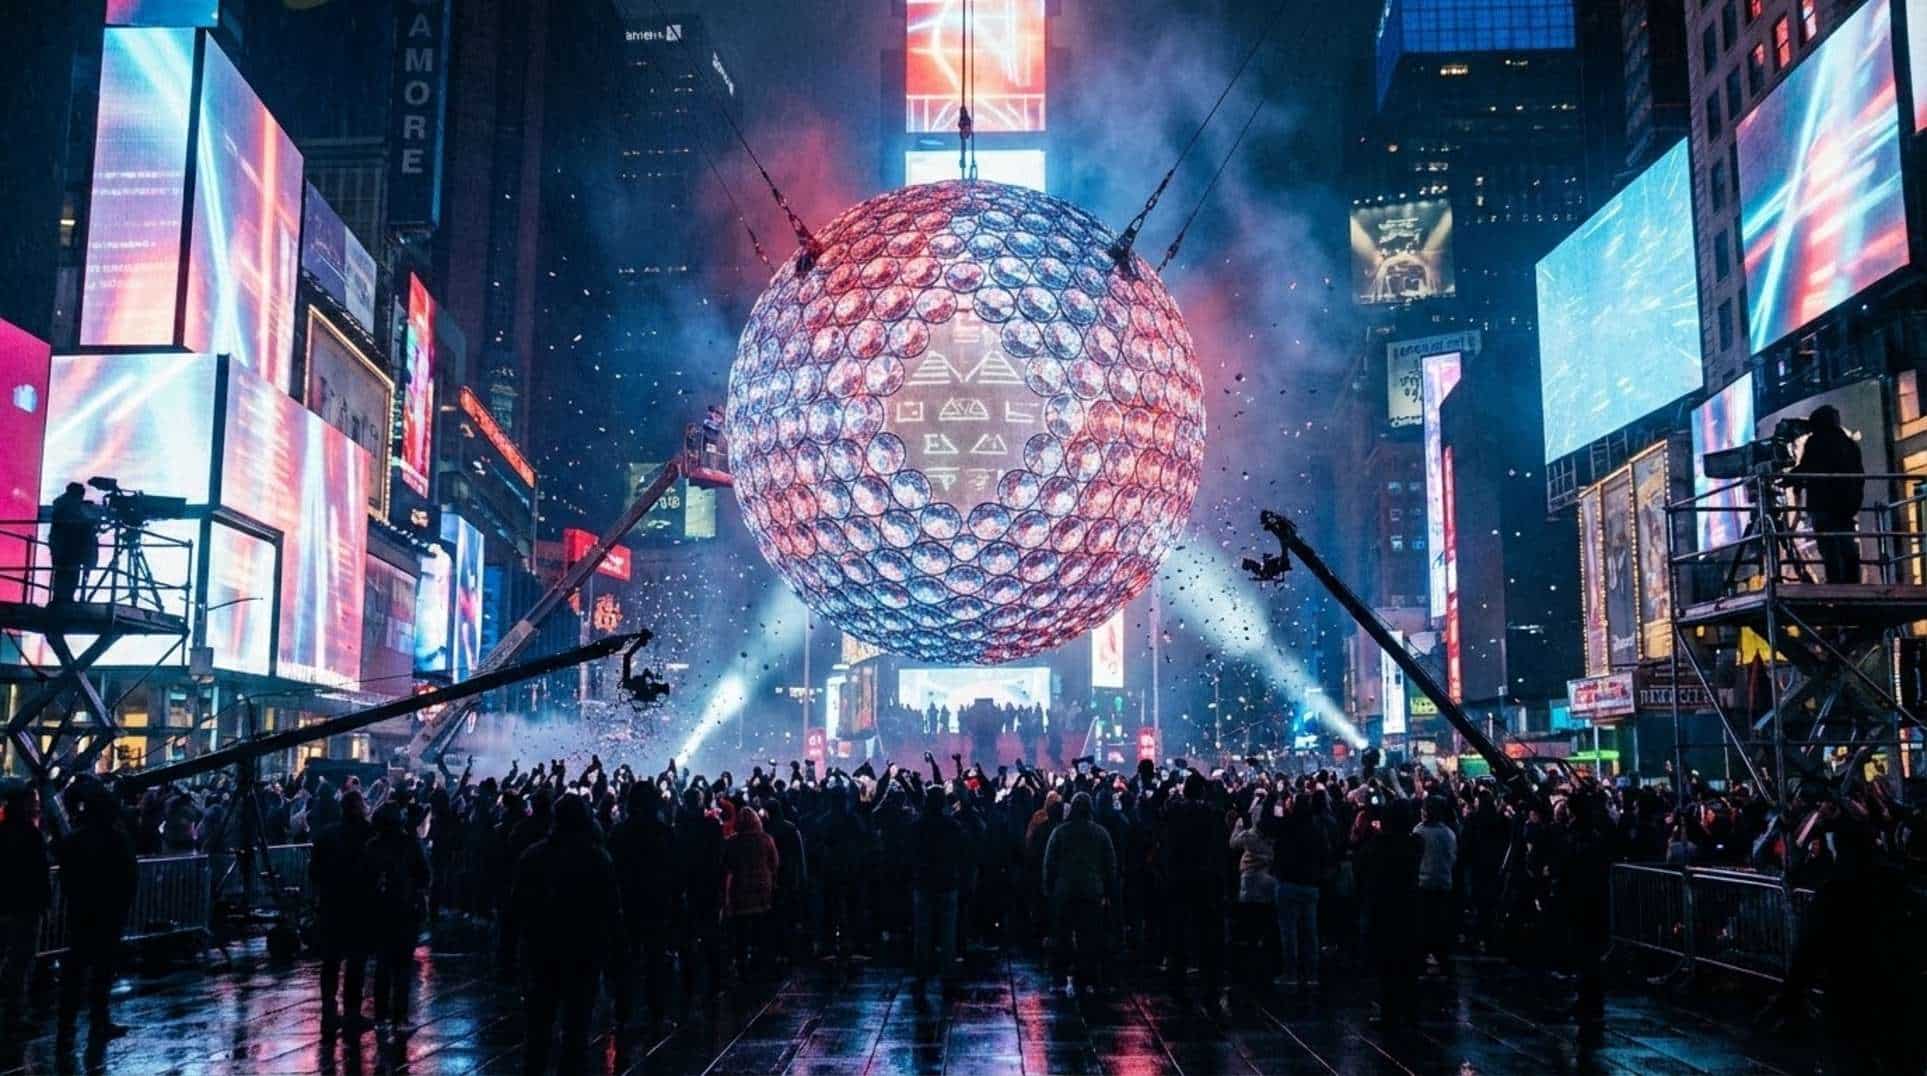
The clock struck midnight on December 31, 2025, ushering in 2026 amid the electric hum of Times Square. Confetti rained down, cheers erupted from the massive crowd, and the iconic Ball completed its descent. But the night held more. At approximately 12:04 a.m. EST, the Ball relit in a burst of red, white, and blue—a scheduled nod to America’s 250th anniversary, per America250 and Times Square press releases.
Picture it: the 2026 ‘Constellation Ball,’ a massive 12.5-foot sphere weighing between 12,000 and 12,350 pounds, adorned with 5,280 Waterford crystal discs and pulsing LED lights, as detailed in Time Out and NBC affiliate reports. The air thick with anticipation, the crowd’s energy still high from the main drop. Then, this second illumination, captured live by broadcasters and the official webcast, reaching millions in person and via streams, according to People and Hollywood Reporter. Something about that relighting lingered, stirring curiosity in the shadows of celebration.
What Witnesses and Analysts Report
From the ground in Times Square to screens worldwide, reactions poured in across social media. Some cheered the patriotic flair, others called it overly commercial, but a notable thread emerged: descriptions of the post-midnight moment as ritualistic or laced with propagandistic undertones. User posts and comments on various platforms document this range, showing how the event hit different notes for different viewers.
That night, viral trends like eating 12 grapes or manifestation rituals at 1:11 a.m. were already buzzing— context from Economic Times, Times of India, Financial Express, and NewsX that explains why symbolic elements in a public spectacle might strike some as more than mere show. Eyewitness clips, network replays, and user uploads capture the relighting, the accompanying video, confetti, and music, serving as raw footage for deeper looks.
Independent researchers have flagged specific imagery and sounds in the segment, linking them to older motifs. These claims deserve careful sourcing through frame-by-frame breakdowns and provenance checks. We’re all piecing this together, respecting the perspectives that see patterns where others see pageantry.
Timelines, Tracks, and Hard Data
Let’s anchor this in the facts. The main event kicked off on December 31, 2025, with the midnight transition, followed by the scheduled America250 relighting at about 12:04 a.m. EST, as outlined in TimesSquareNYC and America250 press releases. The Ball itself: 12.5 feet in diameter, weighing 12,000 to 12,350 pounds, featuring 5,280 Waterford crystal discs, per Time Out and MYNBC5 coverage.
Major broadcasters like ABC’s Dick Clark’s New Year’s Rockin’ Eve, CNN, and CBS aired it live, alongside the Times Square official webcast, according to People and Hollywood Reporter. Crowd on-site: around 1 million for the NYE festivities. Global audience: estimates hit hundreds of millions to 1 billion, cited in CBS News, People, and NYT.
Metric
Value
Source
Event Date/Time
Dec 31, 2025 – midnight; relighting ~12:04 a.m. EST
TimesSquareNYC press release; America250 release
Ball Specifications
~12.5 ft diameter; ~12,000–12,350 lbs; 5,280 Waterford crystal discs
Time Out; MYNBC5
Coverage
ABC, CNN, CBS, Times Square webcast
People; Hollywood Reporter; TimesSquare webcast
Audience Estimates
On-site ~1 million; global hundreds of millions to ~1 billion
CBS News; People; NYT
For verification, check the embedded links to TimesSquareNYC press release, America250 press release, Time Out, MYNBC5, People, CBS, and NYT.
Official Story vs. What the Data Suggests
Organizers from Times Square Alliance and America250 frame the relighting as a straightforward ceremonial start to the U.S. Semiquincentennial—complete with the Ball’s glow, a video segment, confetti, and music, as stated in their press releases. Broadcasting partners and entertainment outlets promoted it as part of the night’s lineup, not some hidden insert, per People and Hollywood Reporter.
Yet viewer interpretations diverge, with some spotting ritual-like qualities in the visuals and audio. No official docs hint at covert or ancient-propaganda motives, but the absence of named production contractors or creative vendors in public materials leaves room for questions. Tracing those could reveal if the imagery pulled from historical sources.
Public events like this often carry symbolic weight, especially for those tuned to such layers. The line between civic theater and deliberate ritual blurs without full provenance on the elements used. Facts back the planned nature, but the ambiguity invites scrutiny.
What It All Might Mean
We can stand firm on this: America250 and Times Square executed a scheduled post-midnight relighting at 12:04 a.m. EST for the Semiquincentennial, broadcast live by major outlets, as confirmed in press releases and network coverage.
Still, questions linger: Where’s the exact viral clip dubbing it ‘ancient propaganda,’ with its link, timestamp, and producer? What about production credits and creative briefs for the video? Frame-by-frame origins of the imagery and music? And viewership stats specifically for that segment versus the midnight drop?
Next steps: Hunt down that clip for analysis, request vendor details from America250, Times Square, and broadcasters; gather timestamped eyewitness videos by location; get precise audience numbers from networks. This matters because it touches how mass events blend pageantry with influence—shaping trust in what we see on the grand stage, especially for those tracking hidden patterns in culture.
Frequently Asked Questions
Yes, it was a planned event at approximately 12:04 a.m. EST, organized by America250 and the Times Square Alliance to mark the Semiquincentennial. Official press releases confirm this, and it was broadcast live by major networks and the Times Square webcast.
Social media reactions and independent analyses point to specific imagery and music in the segment that some view as reminiscent of older motifs. However, these claims need frame-by-frame sourcing and provenance checks, as public press materials don’t document production credits or intent.
On-site crowd estimates for the NYE celebration are around 1 million, with global TV and streaming audiences ranging from hundreds of millions to about 1 billion. Major broadcasters like ABC, CNN, and CBS carried the live coverage, though granular viewership for the post-midnight segment specifically requires further network data.
Times Square Alliance and America250 describe it as a ceremonial kickoff to America’s 250th anniversary, with no mention of covert or ritualistic elements. Press releases and broadcasting promotions frame it as part of the evening’s public programming.
The specific viral clip claiming ‘disturbing ancient propaganda’ hasn’t been located, and production credits for the imagery aren’t publicly documented. This leaves gaps that frame-by-frame analysis and vendor identification could fill, highlighting the need for deeper investigation into the event’s creative sources.