Blog

  • Solar Storms & Earthquakes: What the Data Really Shows

    Solar Storms & Earthquakes: What the Data Really Shows

    Key Takeaways

    • A CME tied to an X1.9 flare from AR4299 hit on December 1 (01/0249 UTC), with models showing at least a glancing blow to Earth, according to NOAA SWPC.
    • NOAA/SWPC put out geomagnetic watches for early December, expecting G1–G2 activity from the CME combined with a large trans-equatorial coronal-hole high-speed stream; some independent models pegged a ~25% chance of isolated G3 levels (SpaceWeatherLive, SolarHam, EarthSky).
    • Mainstream seismology through USGS holds there’s no proven link between space weather and earthquakes, but peer-reviewed studies show mixed results, including a 2025 GRL paper noting a possible 27–28 day elevated risk under certain methods.

    A Quiet Sky, an Electric Night

    The skies stayed calm at first, but as December 1–5 UTC rolled in, things shifted. Aurora forecasts started buzzing, pulling eyes upward. Social feeds erupted with predictions of lights dancing across the poles, mixed with warnings about what might stir below.

    People checked NOAA/SWPC advisories for satellite glitches and service disruptions. Online, community voices amplified the tension—posts about a brewing ‘earthquake watch’ from figures like Stefan Burns. Aurora photos flooded in, livestreams captured the glow, but underneath, anxiety built about fault lines responding to the solar push.

    Short bursts of excitement. Then questions. What if the ground answered back?

    What Witnesses and Analysts Report

    Voices from the community didn’t hold back. Independent analysts like Stefan Burns called it a ‘perfect geostorm’—that mix of CME and trans-equatorial coronal hole ramping up odds for big quakes. They shared warnings on YouTube and social platforms, pointing to the combined solar drivers as a trigger.

    Space-weather trackers at SpaceWeatherLive, SolarHam, and EarthSky backed up the geomagnetic side, forecasting Kp levels around 5–6 for G1–G2 storms, with a slim shot at Kp=7 for isolated G3. Reports spread fast on Reddit, Telegram, and X—aurora sightings, instrument captures, and local alerts tying into quake risks.

    Users highlighted patterns: storms lining up with past shakes, electromagnetic precursors caught on hobbyist gear and seismometers. It’s the kind of talk that resonates in our circles, built on shared observations and historical echoes.

    Timelines, Tracks, and Hard Data

    Let’s pin down the sequence. The X1.9 flare erupted on December 1 (01/0249 UTC) from AR4299, with an associated CME spotted soon after, per NOAA SWPC notes. Forecasts warned of geomagnetic watches for early December, blending the CME with a high-speed stream from a large trans-equatorial coronal hole.

    SWPC expected G1–G2 levels, hinging on the CME’s magnetic field (Bz) and arrival angle. Independent sites like SpaceWeatherLive, SolarHam, and EarthSky modeled Kp at 5–6, with about a 25% chance of hitting 7 for G3 spikes.

    On the quake side, USGS stands firm: no established cause-and-effect with space weather. But studies vary—Nature Scientific Reports (2020) found correlations, MDPI Atmosphere (2022) questioned artifacts, a 2025 GRL paper suggested elevated odds 27–28 days out, and a 2024 Scientific Reports piece noted magnetic-storm signals in seismometer data.

    Metric Value Source
    X1.9 Flare/CME 01 Dec (01/0249 UTC) from AR4299 NOAA SWPC
    Geomagnetic Forecast G1–G2 expected; ~25% chance isolated G3 SWPC / SpaceWeatherLive / SolarHam / EarthSky
    Coronal Hole HSS Large trans-equatorial, enhancing volatility NOAA SWPC / CCMC
    Seismology Stance No demonstrated causal link USGS

    For deeper checks, pull L1 solar-wind data from DSCOVR/ACE for Dec 1–5 UTC, global Kp/Dst indices, and USGS earthquake catalogs to map any events against the storm timeline.

    Official Story vs. What the Data Suggests

    NOAA/SWPC keeps it operational: watches based on probabilistic Kp and G-scales, treating CMEs and coronal-hole streams as distinct but amplifying factors. Uncertainty rules, especially with CME magnetic fields and impact paths.

    USGS and seismologists push back—no proven tie to earthquakes, no reliable electromagnetic precursors after years of scrutiny. Yet community points hold some ground: the Sun delivered real drivers, and models confirmed geomagnetic upticks to G1–G2, maybe G3.

    Where it frays: linking that to quake triggers lacks backing from operational science. Studies conflict, hinging on lag choices, data completeness, and controls. Seismometers can pick up EM noise as artifacts, not true shakes. It’s a divide, respectful but real.

    Lines of Inquiry: How to Test the Claim

    Want to probe this? Start with L1 solar-wind and IMF data from ACE/DSCOVR for Dec 1–8 UTC—check arrival speeds, proton density, Bz shifts for CME and HSS hits.

    Match those to global Kp/Dst and local magnetometer reads for storm timing and strength. Then overlay USGS quake catalogs for M≥5 events in that window, plotting against storm peaks and eyeing regional faults.

    Dig into seismometer traces for EM artifacts vs. real motion—reference the 2024 Scientific Reports methods. Test stats with different lags, subsets, and nulls to see if correlations hold. Reach out to SWPC forecasters, USGS experts, and researchers from the 2025 GRL paper for fresh takes.

    What It All Might Mean

    The Sun threw real punches: an X-class flare/CME plus that trans-equatorial hole, driving confirmed geomagnetic activity to G1–G2 levels, with G3 in play. That’s solid.

    But the quake link? It’s the big open question—USGS says no proof, and studies clash, urging caution on firm claims. This matters because mixing proven space-weather risks to tech with unverified seismic fears can skew priorities. Still, those lingering signals deserve rigorous, transparent scrutiny; validation could change everything.

    Report the solar facts upfront, honor community views, test with data, and keep the cause open. Readers, stick to NOAA advisories for tech impacts—no quake warnings tie in yet.

    Frequently Asked Questions

    Yes, the X1.9 flare from AR4299 on December 1 produced a CME with at least a glancing blow to Earth, as modeled by NOAA SWPC. Combined with a coronal-hole high-speed stream, it led to geomagnetic activity rated G1–G2, with a small chance of G3.

    USGS maintains no demonstrated causal relationship exists. Peer-reviewed studies are mixed, with some finding correlations and others highlighting methodological issues, like a 2025 GRL paper suggesting elevated risks 27–28 days later under specific analyses.

    Independent voices like Stefan Burns described the event as a ‘perfect geostorm’ and warned of higher odds for major earthquakes. Community reports on platforms like YouTube and Reddit cited temporal patterns, past events, and electromagnetic precursors as supporting evidence.

    Cross-reference solar-wind data from ACE/DSCOVR, geomagnetic indices like Kp/Dst, and USGS earthquake catalogs for Dec 1–8. Look for M≥5 events aligning with storm peaks, and check seismometer traces for true seismic signals versus EM artifacts.

    It highlights real solar impacts on tech and auroras, while raising questions about unproven links to quakes. Separating confirmed risks from open hypotheses helps focus on transparent research, potentially revealing new patterns in our monitored reality.

  • UAP Whistleblowers: Danny Sheehan’s Deathbed Puzzle

    UAP Whistleblowers: Danny Sheehan’s Deathbed Puzzle

    Key Takeaways

    • Danny Sheehan, a veteran constitutional attorney and public-interest litigator, has shared details on UAP, whistleblowers, and an alleged deathbed confession across interviews like Debriefed Ep. 29 and other podcasts.
    • The ODNI Preliminary Assessment from June 25, 2021, reviewed 144 UAP reports from 2004 to March 2021, identifying just one case with high confidence—a large deflating balloon.
    • DoD and AARO reports show rising numbers: the FY24 consolidated report logged 757 UAP reports from May 1, 2023, to June 1, 2024, with 485 during that period and 272 from earlier.
    • NASA‘s Independent Study Team released a September 2023 report emphasizing better measurement methods over speculating on origins.
    • Core mysteries persist: the identity and documentation for insiders in Sheehan’s deathbed confession remain unverified publicly, and chain-of-custody for alleged materials like videos or artifacts is absent from the record.

    A Quiet, Tense Room: Setting the Scene

    Picture this: a dimly lit room, the kind where shadows stretch long under a single lamp. Danny Sheehan, with his decades in courtrooms fighting for transparency, leans into a microphone. He’s no stranger to high-stakes battles—think constitutional cases that shook foundations. Now, in podcasts like Debriefed Ep. 29, he recounts late-night calls from whistleblowers, voices hushed with urgency. These aren’t grand stages; they’re intimate spaces, blending legal precision with tales from the intelligence shadows. The air thickens as he describes a deathbed confession, passed through trusted channels, mixing hard facts with the weight of what might be hidden.

    What Witnesses and Analysts Report

    Across the disclosure networks, claims build like pieces of a fractured puzzle. Sheehan draws from his work with whistleblowers and courtroom defenses, relaying second-hand accounts of deathbed confessions—stories of insiders revealing crash retrievals or secret facilities, shared in public interviews but not directly from the source.

    First-person testimony stands out in the public record. Military pilots and radar operators have gone on the record, their accounts driving official inquiries. Think of the Congressional hearings where named witnesses described encounters backed by flight data. These are verifiable: transcripts exist, pilots like those in the 2022 House hearing spoke under oath.

    Then there’s the second-hand layer—community lore about unnamed insiders, alleged S-4 sites, and promises of evidence like photos or videos yet to surface publicly. These circulate among veterans and researchers, but without primary sources, they stay anecdotal. Patterns emerge: consistent reports of anomalous craft defying physics, often from credible military backgrounds. We respect these voices; they’ve earned scrutiny, not dismissal.

    Timelines, Tracks, and Hard Data

    Let’s map the verifiable trail. Official documents offer checkpoints—dates, numbers, and gaps we can probe. The ODNI’s 2021 report set a baseline, analyzing 144 cases. AARO’s updates show the volume swelling, with hundreds more reports logged recently. NASA’s input shifts focus to science, pushing for better tools.

    Public records don’t specify exact counts of multi-sensor cases—those with radar, infrared, and signals intelligence combined. AARO notes many lack the data quality needed for resolution, leaving us to question how many truly hold up under scrutiny.

    Report/Agency Date Dataset Size Key Finding Source
    ODNI Preliminary Assessment June 25, 2021 144 UAP observations (2004–Mar 2021) One case identified with high confidence (deflating balloon); most lack sufficient data ODNI Report Link
    AARO/DoD FY24 Consolidated Report FY24 757 reports (May 1, 2023–June 1, 2024; 485 during period, 272 prior) Growing volume; many unresolved due to data limits AARO FY24 PDF
    NASA UAP Independent Study Team September 2023 Methodological focus, no specific dataset size Recommendations for improved data collection and instrumentation NASA UAPIST Report
    Congressional Hearing May 17, 2022 N/A (testimony-driven) Spurred AARO formation and reporting requirements House Hearing Transcript

    Official Story vs. What the Data Suggests

    Agencies like ODNI frame UAP as safety and security issues, citing data shortages that prevent firm conclusions. They identified one balloon in 144 cases, but most remain open due to incomplete info. AARO echoes this, standardizing reports while guarding classified methods—no public evidence of captured tech, just unresolved entries.

    NASA stays measured, advocating for better sensors and open data without jumping to origins. Congress, through hearings, pushes for more, leading to AARO’s birth.

    Sheehan and the community see it differently. His legal background in classified cases leads him to suspect withheld evidence—crash sites, footage, programs buried deep. These views highlight potential suppression, but verifiable facts stop at institutional walls. Oversight exists: congressional reviews, inspector general probes, FOIA requests. Yet national security exemptions block much, leaving speculation about black-budget ops. The tension is real—data suggests anomalies, but classification could hide the rest.

    What It All Might Mean

    Pulling threads together, the solid ground includes ODNI’s 144 incidents, AARO’s 757 recent reports, and NASA’s call for rigorous science. These point to something persistent in our skies, demanding attention.

    Questions linger: Who is the insider behind Sheehan’s deathbed tale, and where’s the primary documentation? Can alleged materials get chain-of-custody verification? What fraction of cases boast multi-sensor proof?

    This matters—for flight safety, security, science, and trust. Legal paths like hearings or FOIA could unlock more. Mystery remains, a shadow worth chasing.

    Frequently Asked Questions

    Sheehan discusses whistleblower accounts and a deathbed confession involving alleged crash retrievals and secret facilities, shared in interviews like Debriefed Ep. 29. These are second-hand narratives without public verification.

    ODNI’s 2021 assessment reviewed 144 reports, identifying one balloon. AARO’s FY24 report catalogs 757 cases, many with insufficient data. NASA’s 2023 study recommends better measurement tools.

    Agencies cite data gaps and classification for caution. Sheehan argues legal and oversight hurdles hide evidence, with tools like FOIA and hearings offering potential paths forward.

    Public records don’t provide exact counts, but AARO notes many cases lack high-quality data for analysis. Some pilot testimonies include radar and visual corroboration.

    Target FOIA requests at AARO documents, seek affidavits via congressional oversight, and advocate for forensic reviews of alleged materials.

  • Ancient Supertech Myths: Antikythera to Puma Punku

    Ancient Supertech Myths: Antikythera to Puma Punku

    Key Takeaways

    • Artifacts like the Antikythera mechanism, Göbekli Tepe, and Puma Punku display technical and organizational feats that have sparked debates since their discovery, challenging early assumptions about ancient capabilities.
    • Mainstream explanations rely on solid data—CT scans and inscriptions for Antikythera, radiocarbon dating for Göbekli Tepe, and calibrated samples for Puma Punku—placing them firmly in historical contexts with known tools and societies.
    • Unresolved issues persist: How widespread was advanced gear knowledge? What social structures enabled massive pre-agricultural builds? Can Puma Punku’s precision be matched exactly with stone tools, or do other theories need more proof?

    A Slow, Metallic Heart, A Circle of Pillars, A Plateau of Cut Stone

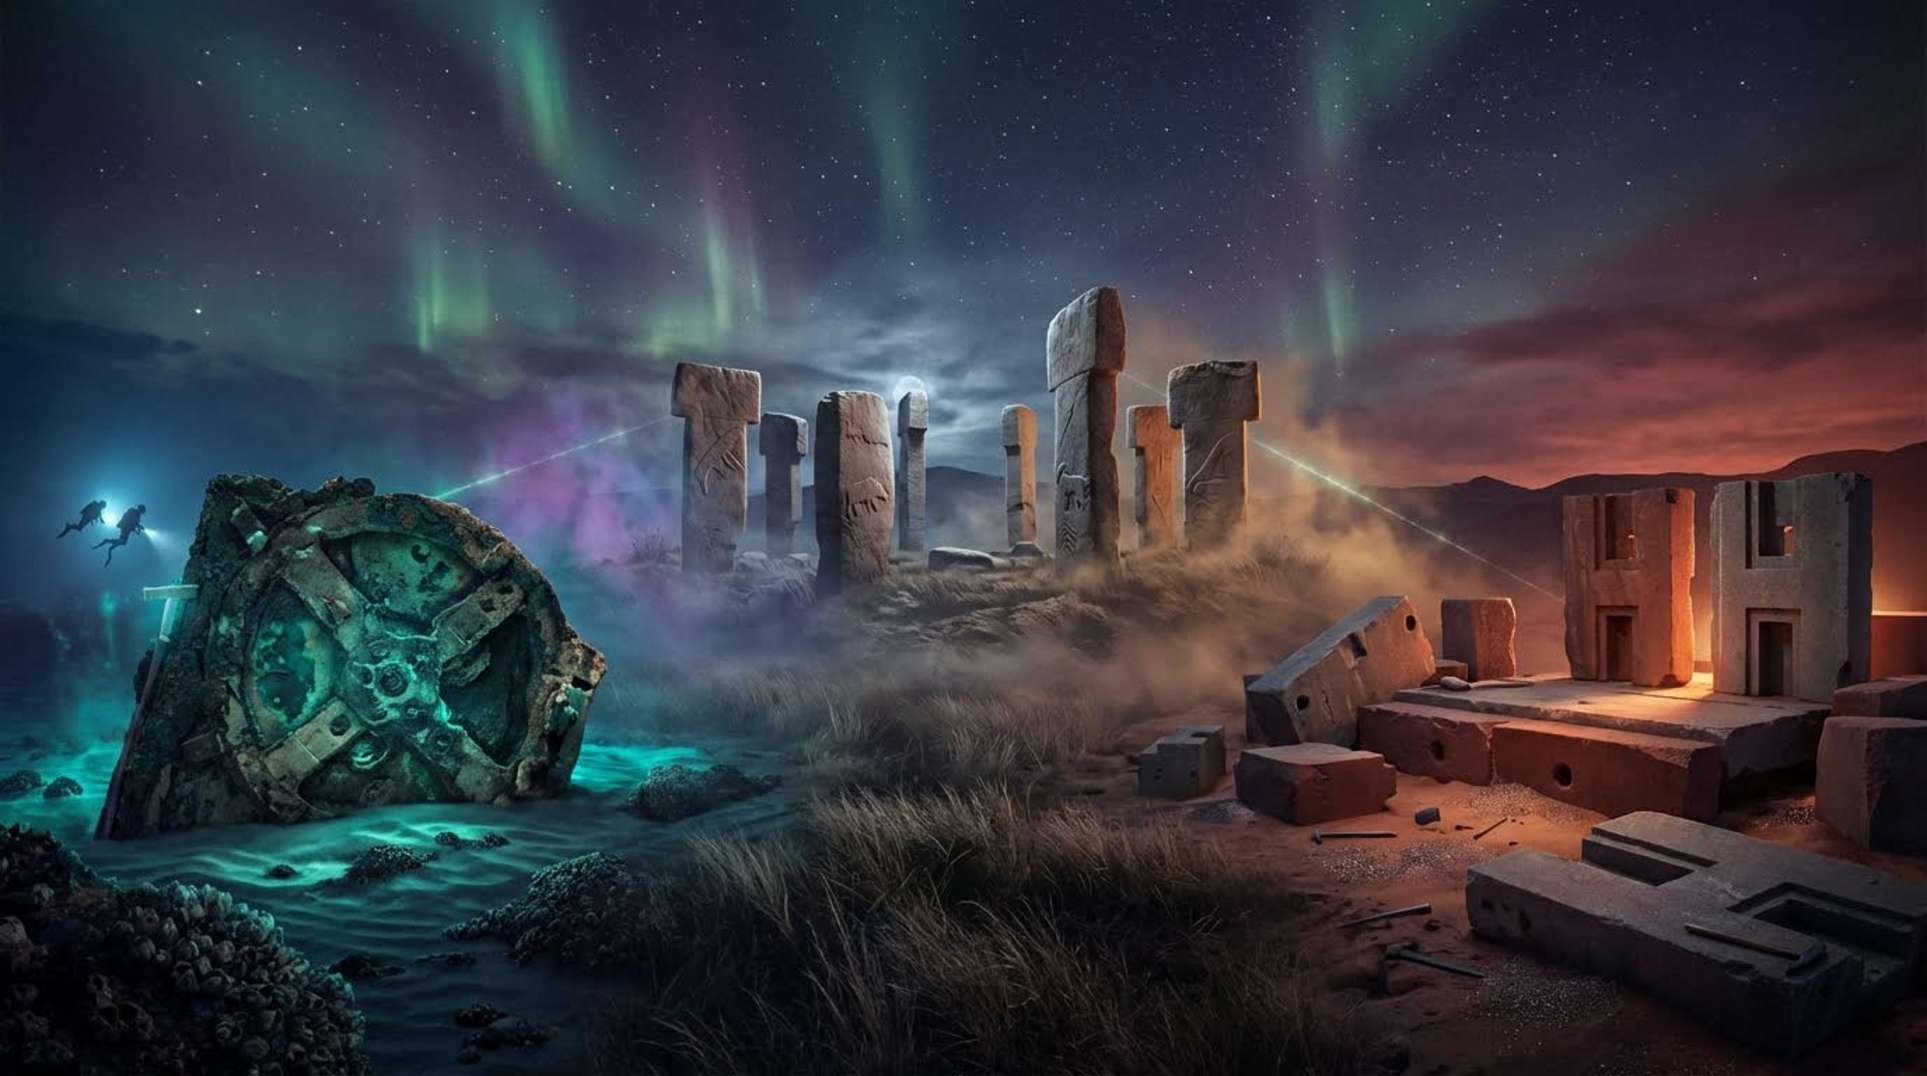
    Picture this: divers in 1900 pull corroded bronze fragments from a Roman-era shipwreck near Antikythera, Greece. X-ray CT scans over a century later uncover interlocking gears and faded inscriptions inside.

    Shift to a windy ridge in Anatolia, where circular enclosures rise with massive T-shaped limestone pillars, their carvings staring back from 9600–8000 BCE, long before settled farms.

    High in the Andes, Puma Punku’s vast andesite and red-sandstone blocks lock together with tight joints and drilled holes, tied to Tiwanaku’s first-millennium world.

    These scenes pull at our ideas of progress. Why do they feel out of place? What hidden hands shaped them across time?

    What Witnesses and Analysts Report

    Excavators and conservators hail the Antikythera mechanism as a pinnacle of Hellenistic engineering. Teams count gears, decode inscriptions, and map its astronomical predictions. Online forums echo this, but some push further, questioning if such skill was unique or part of a lost tradition.

    At Göbekli Tepe, Klaus Schmidt’s teams uncovered monuments that rewrite timelines for human organization. They argue these Pre-Pottery Neolithic structures show complex societies without full agriculture. Enthusiasts online see proof of advanced prehistoric networks, sharing reports of symbols and alignments that hint at deeper purposes.

    Puma Punku draws sharp lines. Ancient-technology advocates highlight the blocks’ precision, calling it impossible with basic tools. Experimental archaeologists counter by demonstrating cuts and joints using hard stones and abrasives, though debates rage in comment threads about whether every feature matches perfectly.

    Across these cases, patterns emerge. Specialists test methods against evidence, while communities propose bolder ideas. Both sides draw from the same artifacts, fueling respectful back-and-forth in search of truth.

    Timelines, Measurements, and the Hard Data We Can Check

    Let’s pin down the facts. Recovery dates, imaging results, and material analyses give us anchors. For quick comparison, here’s a table of key metrics:

    Site/Artifact Key Metric Value Source
    Antikythera Mechanism Recovery Date 1900–1901 Historical records
    Antikythera Mechanism Gear Count ~30 surviving gears CT imaging (Nature 2006)
    Antikythera Mechanism Largest Gear Diameter ~13 cm UCL/Antikythera research
    Antikythera Mechanism Estimated Manufacture Late 2nd century BCE Major publications
    Göbekli Tepe Construction Date ca. 9600–8000 BCE Radiocarbon/stratigraphy
    Göbekli Tepe Key Features Circular enclosures with T-shaped pillars Excavations (1995–2014)
    Puma Punku Earliest Date ca. AD 536–600 Calibrated radiocarbon
    Puma Punku Materials Andesite and red-sandstone blocks Archaeological reports

    These details come from peer-reviewed sources and fieldwork. Antikythera’s CT scans revealed thousands of inscription characters. Göbekli Tepe’s dates hold via multiple samples. Puma Punku’s debates center on whether stone tools alone explain the tight joints or if ideas like geopolymer casting deserve lab tests.

    Official Story vs. What the Data Suggests

    Academic teams at the National Archaeological Museum in Athens describe Antikythera as Hellenistic gearwork for tracking stars and eclipses. Publications in Nature and Scientific Reports back this with CT data and reconstructions. Yet, community discussions probe if similar devices existed elsewhere, pointing to gaps in workshop evidence.

    The German Archaeological Institute frames Göbekli Tepe as built by hunter-gatherers pushing social boundaries before farming took hold. Radiocarbon confirms the timeline, but interpreters debate the rituals or knowledge that drove such effort—official views stick to archaeology, while independents suggest astronomical ties.

    Mainstream Andean experts tie Puma Punku to Tiwanaku’s rise around AD 500, crediting organized labor and stone tools for the work. Experimental replications support this. Alternative voices propose casting methods, citing visual precision, though these lack consensus without more microstructural analysis.

    Where views clash: Hard data locks in dates and materials, but interpretations of skills and societies stay open. We weigh evidence fairly—peer-reviewed tests against field observations—without dismissing either side.

    What We Know, What We Don’t, and Why It Matters

    We know Antikythera is authentic Hellenistic engineering, with gears and inscriptions proving its astronomical role. Göbekli Tepe stands as early Holocene monument-building by non-farming groups. Puma Punku’s blocks show Tiwanaku precision in stone.

    Questions linger: How did gear-making knowledge spread? What networks built Göbekli Tepe without agriculture? Do Puma Punku’s features demand tools beyond what’s documented, or can experiments close the gap?

    These debates touch bigger ideas—lost skills, hidden histories, human ingenuity. Better data from scans, digs, and replications could bridge divides. It’s about respecting the evidence while chasing the unknowns that redefine our past. What patterns will emerge next?

    Frequently Asked Questions

    Dated to the late 2nd century BCE, the Antikythera mechanism is a bronze gear device recovered from a shipwreck in 1900–1901. CT scans reveal it tracked astronomical events like eclipses and planetary positions, showcasing advanced Hellenistic engineering.

    Radiocarbon dating places its construction around 9600–8000 BCE, before widespread agriculture. The site’s massive T-shaped pillars and enclosures suggest complex social organization among hunter-gatherers, challenging traditional timelines for monumental builds.

    Mainstream archaeology attributes the precision to first-millennium CE Tiwanaku techniques using hard stone tools, with experiments reproducing many features. Debates continue over whether every aspect matches perfectly, with some proposing alternative methods like geopolymer casting needing more evidence.

    Antikythera’s date comes from historical context and publications. Göbekli Tepe relies on radiocarbon and stratigraphy. Puma Punku’s timeline is based on calibrated samples from mound fills, around AD 536–600, all backed by peer-reviewed data.

    While dates and materials are confirmed, questions about skill distribution, social structures, and exact manufacturing methods remain open. Communities and specialists interpret the same data differently, driving ongoing research and experiments to test hypotheses.

  • Russia’s ‘Nuclear Night’: Policy Shift or Deadly Signal?

    Russia’s ‘Nuclear Night’: Policy Shift or Deadly Signal?

    Key Takeaways

      • Russia updated its nuclear-use policy on November 18–19, 2024, broadening language and increasing public signaling (Arms Control Association; NBC News).
      • Markets showed a risk-off response around these signals: global equities fell while bonds and safe-haven currencies gained, reported by The Guardian on November 19, 2024; academic work documents a “proximity penalty” for stocks near Ukraine.
      • Major uncertainties remain: whether doctrinal shifts lower actual thresholds for use; how reliable viral “mushroom cloud” videos are as evidence of radiological events; and what legal, operational, and political constraints would limit NATO responses.

    The Night the Sky Looked Nuclear

    Social media filled with dramatic clips: towering, mushroom-shaped fireballs and massive plumes after large explosions. Eyewitnesses linked the footage to strikes on depots, airfields, and industrial sites. The timing overlapped with heightened Russian nuclear signaling following policy changes in November 2024 and earlier tactical-nuclear drills in May 2024, and markets reacted with visible risk-off moves. In the fog of those hours, visual horror, rumor, and geopolitical fear amplified one another.

    Witness Accounts and Independent Analysis

    Many frontline witnesses and citizen journalists interpreted the mushroom-shaped plumes as indicative of nuclear or radiological detonations, especially when strikes hit sites thought to contain nuclear materials. Typical evidence included shaky videos, photos of large plumes, and reports of intense thermal flashes.

    However, independent analysts, monitoring groups, and the IAEA caution that large conventional explosions, fuel or munitions conflagrations, and blast-driven fireballs can mimic mushroom-like shapes without any radiation release. In several high-profile viral cases, follow-up checks found no radiological signatures or produced inconclusive results.

    Timeline, Sources, and Market Signals

    Summarizing verifiable points helps separate signal from noise. Key public items include: Russia’s May 2024 tactical-nuclear drills (reported by Al Jazeera); the November 18–19, 2024 doctrinal update (Arms Control Association; NBC News); and market coverage and analysis (The Guardian; academic studies on proximity effects).

    Date Event Source Market Signal
    May 6, 2024 Drills including tactical nuclear practice announced. Al Jazeera Baseline (pre-escalation)
    November 18–19, 2024 Russia revises and publicizes broader nuclear-use language. Arms Control Association; NBC News Global equities fall; bonds and safe-haven currencies rise (The Guardian)
    December 1–2, 2025 NATO official states the alliance is “studying everything,” including potential pre-emptive options. Reuters; The Independent Statement-driven volatility risk
    2024–2025 U.S. reports and CRS analyses document upgrades to Russia’s non-strategic nuclear posture. U.S. State Department; CRS Persistent proximity-driven risk patterns

    Primary documents (doctrinal texts, official translations) and radiation-monitoring data remain the most decisive evidence to collect for confirmation.

    Official Statements vs. Measured Data

    Moscow frames doctrinal changes as responses to perceived Western escalations (long-range weapons, force posture). NATO and allied officials have responded with public ambiguity; some leaders have discussed studying more forceful options, prompting diplomatic pushback from Moscow. Open-source and governmental monitoring bodies emphasize that visuals alone are insufficient to demonstrate a radiological incident and call for measured verification.

    Where independent follow-ups were possible, many viral claims of nuclear detonations were not corroborated by radiation readings or by forensic analysis of blast signatures.

    How Markets Reacted

    Narrative shocks and explicit signaling drove rapid financial reactions. In November 2024, heightened nuclear rhetoric coincided with risk-off trades: equity indices fell, government bonds rallied, and safe-haven currencies strengthened. Empirical research documents larger negative abnormal returns for firms and markets closer to conflict zones—termed a “proximity penalty.” The intensity and persistence of market moves depend on whether the episode resolves quickly or escalates further.

    Interpretation and Remaining Questions

    What is clear: Russia publicly broadened its nuclear-use language in November 2024, and populist visual shock events can trigger measurable market dislocations. What is uncertain: whether the doctrinal shift meaningfully lowers real-world thresholds for nuclear employment; the actual size and distribution of Russia’s non-strategic arsenal; and how reliably open-source videos indicate radiological harm.

    Practical next steps for analysts and policymakers: obtain and translate the full doctrinal text; collect and publish any available radiological monitoring data; develop a time-stamped strike-to-viral-to-market dataset; and analyze legal and operational constraints on potential NATO measures.

    Frequently Asked Questions

    Russia codified broader nuclear-use language on November 18–19, 2024, increasing public signaling, according to Arms Control Association and NBC News. This followed earlier tactical-nuclear drills in May 2024 (Al Jazeera).

    Witnesses often interpret them that way, but independent analysts and the IAEA note that large conventional explosions can produce similar plumes without radiological release. Many viral claims have been disputed or remain unverified without radiation data.

    During the November 2024 signaling, global equity indices dropped while bonds and safe-haven currencies rose (The Guardian). Academic studies find larger negative impacts for markets and firms closer to the conflict zone.

    Moscow frames its updates as defensive responses; NATO officials have publicly discussed contingency options. U.S. government reports acknowledge doctrinal changes but emphasize significant intelligence gaps about operational thresholds.

    Open questions include whether doctrinal language translates into lower real-world thresholds for nuclear use, how often viral footage aligns with radiological events, and what operational constraints would limit pre-emptive responses. Independent, verifiable radiation monitoring and classified inventory data remain the critical gaps.

  • 3I/ATLAS: Why This Interstellar Comet Isn’t Just Natural

    3I/ATLAS: Why This Interstellar Comet Isn’t Just Natural

    Key Takeaways

    • 3I/ATLAS, the third confirmed interstellar object, was discovered on July 1, 2025, following a hyperbolic trajectory not bound to the Sun.
    • Its perihelion on October 30, 2025, and closest Earth approach on December 19, 2025, align closely with three Mercury–Uranus oppositions on October 29, November 19, and December 10, 2025.
    • Observers note a 16.16-hour brightness pulsation and cryovolcanic jets; agencies call it a natural comet, but independent voices point to possible signals or consciousness shifts.
    • Community reports include dreams, EM anomalies, and geophysical correlations, treated here as valid data points.
    • Official data supports a natural origin, yet questions linger about withheld details and symbolic timings.

    Key Signals from an Interstellar Visitor

    Let’s get straight to it. 3I/ATLAS stands as the third confirmed interstellar object, spotted on July 1, 2025, racing through our solar system on a hyperbolic path that won’t loop back to the Sun. What grabs attention is the timing: its solar closest point around October 30, 2025, and Earth flyby on December 19, 2025, framing three precise Mercury–Uranus oppositions on October 29, November 19, and December 10, 2025. Astrologer Dan Waites and geophysicist Stefan Burns both zero in on this overlap, seeing potential beyond coincidence. Reports highlight a 16.16-hour brightness cycle and cryovolcanic jets. Agencies label it a standard comet, but independents and experiencers spot patterns hinting at consciousness changes, odd data, or deliberate signals—still unexplained.

    Under a Nervous Sky: When an Interstellar Comet Met a Restless Mercury

    Late October 2025. The air feels charged. 3I/ATLAS barrels inward at 137,000 mph, nearing its October 30 perihelion at 1.4 AU from the Sun. Just a day before, on October 29, Mercury opposes Uranus exactly—mind against shock, messages clashing with the unexpected. Stefan Burns, geophysicist, pores over orbital tracks and Earth data, sensing subtle shifts. Dan Waites, astrologer, charts the transits, reading Mercury’s signals disrupted by Uranus’s wild energy. Online forums hum with talk of omens, synchronicities. A visitor from beyond our system streaks through, and the sky seems to hold its breath. Something gathers.

    What Researchers, Dreamers, and Skywatchers Are Reporting

    In the corners where UFO trackers and paranormal analysts gather, 3I/ATLAS isn’t just another comet. As only the third known interstellar wanderer after ‘Oumuamua and 2I/Borisov, it draws eyes. Stefan Burns scans for geophysical ties—electromagnetic ripples, seismic clusters, ionospheric oddities—lining up with the comet’s dates, though he stops short of claiming cause. Dan Waites frames the Mercury–Uranus oppositions as jolts to thought and communication, amplified by this cosmic arrival. Forums buzz with vivid dreams around those dates, intuitive ‘downloads,’ flickering gadgets, and a felt information field from the object. Some link it to Avi Loeb’s takes on ‘Oumuamua, pondering non-natural angles. Others discuss a collective shift or disclosure nudge from the triple oppositions.

    Timelines, Orbits, and the Data We Can Actually Touch

    Ground this in facts. 3I/ATLAS emerged on July 1, 2025, via Chile’s ATLAS telescope, confirmed interstellar with eccentricity over 3. Pre-discovery signs of cometary outgassing date to May 7, 2025—steady, no bursts. It clocked 137,000 mph at discovery, hit perihelion October 30 at 1.4 AU, and skimmed Earth at 1.8 AU on December 19. Nucleus up to 20 km, with dust coma and cryovolcanic jets. That 16.16-hour brightness pulse? Likely rotation or jet releases. Astrologically, those Mercury–Uranus dates bracket it tight. Hubble, JWST, and ESA’s ExoMars refined the path—no wild deviations reported.

    Metric Details
    Discovery Date July 1, 2025
    Eccentricity >3 (hyperbolic)
    Speed at Discovery 137,000 mph (221,000 km/h)
    Perihelion Date & Distance October 30, 2025 at ~1.4 AU
    Closest Earth Approach December 19, 2025 at ~1.8 AU
    Pulsation Cycle 16.16 hours
    Mercury–Uranus Oppositions October 29, November 19, December 10, 2025

    Natural Visitor, Hidden Data, or Something Signaling Through the Noise?

    NASA and ESA stick to the script: 3I/ATLAS is a natural interstellar comet, with coma, sublimation, and jets proving it. No threat, just science on extrasolar makeup. Harvard teams echo that, while noting speculation. ExoMars data tweaks the orbit—nothing exotic. But independents push back. Some, echoing Avi Loeb on ‘Oumuamua, question if jets or the precise 16.16-hour pulse signal intent, not chance. Burns hunts geophysical matches to the oppositions and comet dates—no solid links yet, but the search continues. Waites sees symbolic disruption: Mercury’s messages shocked by Uranus, timed with this outsider. Community whispers of withheld images fuel distrust, especially with past delays. The pulse fits rotation models, but its neatness raises brows. Officials ignore subjective reports; experiencers say they’re key.

    Patterns at the Edge: Folklore, Omens, and High-Strangeness Echoes

    Comets have long signaled change—upheaval, plagues, shifts in power. An interstellar one amps that. Forums tie 3I/ATLAS to dreams of star travelers, timeline fractures, metaphoric contact. Like with ‘Oumuamua, some felt presence without proof. Claims of suppressed data echo old patterns, stoking suspicion. Mercury–Uranus hits thrice: messenger versus alien disruptor, framing reports as synchronicity. Burns stays measured, chasing data ties. Waites draws on cycles, seeing archetypal echoes. Both sense a threshold, where science and symbol meet.

    Standing in the Beam: What We Know, What We Don’t, and Why It Still Matters

    Here’s the solid ground: 3I/ATLAS, eccentricity >3, discovered July 1, 2025; perihelion October 30 at 1.4 AU; Earth close December 19 at 1.8 AU; 20 km nucleus, 16.16-hour pulse from rotation or jets. Those oppositions—October 29, November 19, December 10—frame it neatly. Agencies see natural comet, no anomalies. Yet questions persist: geophysical correlations? Spectral surprises? Pulse structure? How to weigh dreams and strangeness? This visitor probes extrasolar worlds, stirs cultural tales of contact, mirrors our hopes for an intelligent cosmos. Both views remain partial. Hold the uncertainty— that’s where truth hides.

    Frequently Asked Questions

    3I/ATLAS is the third confirmed interstellar object, discovered on July 1, 2025, on a hyperbolic trajectory not bound to the Sun. It shows cometary features like a dust coma and cryovolcanic jets, with a nucleus up to 20 km in diameter.

    The comet’s perihelion on October 30, 2025, and Earth approach on December 19, 2025, bracket three oppositions on October 29, November 19, and December 10. Astrologers like Dan Waites see this as symbolic of disrupted communications and shocks, while others hunt for geophysical links.

    NASA and ESA describe it as a natural interstellar comet, with no threats or anomalies beyond expected behavior. Data from Hubble, JWST, and ExoMars support this view, focusing on its scientific value for studying extrasolar materials.

    Community forums report vivid dreams, intuitive impressions, and electromagnetic anomalies around the key dates. Some speculate the 16.16-hour brightness pulsation or jets could indicate intent, though officials attribute these to natural rotation and outgassing.

    Some skywatchers suspect delays in high-resolution images and data releases, drawing from patterns with past objects like ‘Oumuamua. However, this could stem from standard processing times, amid broader distrust of institutional handling.

  • 3I/ATLAS: Interstellar Comet or Alien Probe?

    3I/ATLAS: Interstellar Comet or Alien Probe?

    Key Takeaways

    • 3I/ATLAS is the third confirmed interstellar object after 1I/ʻOumuamua (2017) and 2I/Borisov (2019); it’s on a hyperbolic (unbound) trajectory, meaning it came from outside the Solar System and will never return.
    • Core observables: discovered July 1, 2025 by the ATLAS telescope in Chile at about 4.5 AU from the Sun; perihelion on October 29, 2025 at about 1.4 AU (just inside Mars’ orbit); closest approach to Earth around 1.8 AU (~170 million miles) and no impact risk according to NASA and ESA.
    • The genuine questions: unusually high CO2 abundance in its coma, detectable nickel emissions, its steady activity without major breakups, and how upcoming Hubble/James Webb images might confirm a purely natural comet—or deepen the debate over artificial or exotic origins.

    Nineteen Days Before the Visitor Arrives

    The clocks are ticking. Observatories around the world hum through the night, telescopes trained on a faint streak cutting across the stars. Online forums buzz with countdowns, users refreshing feeds for the latest spectra or snapshots. We’re just 19 days from 3I/ATLAS’s closest pass to Earth, the window when Hubble and the James Webb Space Telescope will deliver their clearest views of this interstellar wanderer. There’s an undercurrent of unease in the air—memories of ʻOumuamua’s unexplained acceleration and Borisov’s more familiar comet traits linger, framing this new arrival as part of something bigger, unresolved.

    Picture it: amateur scopes stacking images under dark skies, Reddit threads exploding with dissections of every pixel. At speeds reaching 153,000 mph near perihelion, this Manhattan-sized object barrels through, staying a safe 1.8 AU away. Yet the wait feels heavy. What will those high-res images reveal about its nucleus and coma? We’ve been here before, peering into the unknown, wondering if what’s coming is just rock and ice—or a sign of something more.

    What People Around the World Say They’re Seeing

    Across platforms like Reddit, X, TikTok, and dedicated forums, the discussions run hot. Many are piecing together patterns, questioning if 3I/ATLAS is more than a natural comet—perhaps an artificial craft, a probe, or even a mothership releasing smaller units as it traverses the outer system. These ideas draw from visual clues and behaviors that don’t quite fit the standard mold.

    Amateurs report a “weird tail” with anti-tail features—dust seeming to point toward the Sun instead of away—along with brightness fluctuations in the coma that appear more controlled than the erratic crumbling of typical comets. Some link it to broader lore, speculating ties to events like the 1908 Tunguska explosion, imagining prior passes or debris, even as the observed hyperbolic path rules out Solar System origins.

    There’s talk of image inconsistencies too: differences between raw frames and the polished versions from agencies, raising suspicions of color tweaks or composites that might hide details. Avi Loeb’s comments add weight—he’s suggested interstellar objects could deploy probes near planets like Jupiter, which resonates here as a nod from academia to what many feel intuitively. And a recurring theme emerges: these visitors show up, officials downplay anything unusual, but anomalies persist, fueling the sense of a pattern that’s been ignored too long.

    Timelines, Tracks, and the Hard Numbers on 3I/ATLAS

    Let’s ground this in the verifiable data. 3I/ATLAS was first detected on July 1, 2025, by the ATLAS telescope in Chile, initially pegged as a cometary body at about 4.5 AU from the Sun. Its hyperbolic orbit—eccentricity over 1—confirms it’s not bound to our Sun, hailing from interstellar space.

    Key milestones: perihelion hit on October 29, 2025, at 1.4 AU, just inside Mars’ orbit. Closest to Earth? Around 1.8 AU, or 170 million miles. Speeds peaked at 153,000 mph near the Sun, fitting for an object slung through the gravity well. The nucleus is estimated at 10–20 km across, roughly Manhattan-sized, with an active coma and evolving dust tail visible since at least May 2025.

    Spectra reveal high CO2 in the coma and nickel emissions—standouts that spark both scientific interest and speculation. Missions like MAVEN, Psyche, and Lucy have grabbed opportunistic data, cross-verifying ground observations.

    Metric Details
    Discovery Date July 1, 2025
    Perihelion Date October 29, 2025
    Closest Approach to Earth ~1.8 AU (170 million miles)
    Maximum Observed Speed ~153,000 mph (246,000 km/h)
    Distance at Discovery ~4.5 AU (410 million miles)
    Estimated Size 10–20 km diameter

    How the Agencies Explain It—and How Others Read the Same Data

    On the orbit: The official line says it’s a natural interstellar comet on a hyperbolic trajectory, ejected from another star system, with ice and dust responding to solar heat. Engaged observers interpret this as potentially masking a guided path, noting how the steady track avoids easy dismissal of artificial navigation.

    On composition: Agencies see the high CO2 and nickel as markers of a unique formation environment, exciting for science. Observers counter that these ratios resemble engineered materials or exhaust, not just random cosmic quirks, especially given the object’s stability.

    On morphology: Tail and anti-tail are chalked up to viewing angles and dust alignment, common in comets. But skeptics highlight the features’ sharpness and persistence, suggesting directed jets or thrusters rather than passive ejection.

    On imaging: Official releases emphasize composited, color-mapped visuals for clarity, with some raw data available. Communities point to discrepancies between versions, arguing this echoes past missions where edits hid sensitive details, leaving trust issues in play.

    The Gaps in the Data—and the Questions No One Can Yet Answer

    Plenty remains open, acknowledged on all sides. The exact stellar nursery of 3I/ATLAS is unknown—its CO2 richness and nickel hint at a colder, distinct birthplace, but without more, it’s guesswork.

    Dynamically, we lack its full galactic backstory; models offer probabilities, but no precise trail. Its steady activity, avoiding major breakups despite size and solar proximity, puzzles even experts, defying easy simulations.

    With only three interstellar objects known, ‘normal’ is undefined—what seems odd in 3I/ATLAS might prove standard as more arrive. And until Hubble and Webb’s peak images drop, nucleus details are fuzzy, forcing extrapolations that could swing either way with new data.

    These aren’t traps but the edge of what we know. Speculation fills the voids, and incoming observations might reshape everything.

    What 3I/ATLAS Might Still Be Hiding

    We know this much: 3I/ATLAS is interstellar, hyperbolic, clocking 153,000 mph at perihelion, and keeping 1.8 AU from Earth. Teams worldwide confirm its comet-like traits.

    But the edges intrigue—elevated CO2, nickel, and intact passage through perihelion mark it as unusual, even among rarities. Cover-up claims lack direct proof, yet history shows agencies favoring safe stories, breeding skepticism.

    Watch for Hubble/Webb shots, refined spectra, and emerging papers; public archives will let you dig in. Strong artificial signs? Non-gravitational shifts beyond outgassing, geometric structures, or cross-instrument oddities. Natural lean? Consistent comet models fitting all data.

    Either way, it pushes us to sit with the unknown, chasing truth over comfort. Stay tuned—the next weeks could change the conversation.

    Frequently Asked Questions

    3I/ATLAS is the third confirmed interstellar object, following ʻOumuamua and Borisov, on a hyperbolic trajectory from outside our Solar System. Its significance lies in unusual features like high CO2 abundance and nickel emissions, sparking debates over natural versus artificial origins, especially with upcoming high-res images from Hubble and James Webb.

    According to NASA and ESA, it poses no impact risk, with closest approach at about 1.8 AU or 170 million miles. Official assessments emphasize this as a closed question, though some observers question if anomalies are being downplayed.

    Community reports highlight steady activity without breakups, anti-tail features resembling directed jets, unusual chemistry like high CO2 and nickel, and potential image inconsistencies. Figures like Avi Loeb have speculated on artificial possibilities, such as probe deployment, though mainstream views hold it’s a natural object until proven otherwise.

    We’re 19 days from its closest pass, when Hubble and James Webb are set to capture sharpest images. New spectra and analyses from missions like MAVEN, Psyche, and Lucy will add details, with some data hitting public archives for independent review.

    Agencies describe it as a natural comet with exciting but explainable traits, like tail geometry from viewing angles. Observers see patterns suggesting artificiality, such as controlled activity or engineered materials, pointing to a trust gap fueled by past handling of anomalies.

  • Kyiv’s Vanishing Skyline: Blackout, Not the Paranormal

    Kyiv’s Vanishing Skyline: Blackout, Not the Paranormal

    Key Takeaways

    • A Kyiv resident wakes to an unprecedented, total blackout of the skyline, in a city already used to rolling outages and air raids.
    • Russia has systematically targeted Ukraine’s power grid since 2022, including a December 2015 cyber-attack impacting over 230,000 people and massive missile/drone strikes in August and November 2024 that triggered widespread blackouts and 10–12-hour daily outages in some periods.
    • Gaps persist around how cyber and physical attacks interact, whether any unusual environmental or electromagnetic phenomena accompany these events, and how the psychological ‘high-strangeness’ of a modern capital going fully dark shapes witness perception and folklore-like narratives.

    The Morning After a Vanished Skyline

    Imagine stirring awake in Kyiv, a sprawling European capital where, even amid war, the night usually holds some flicker of life—headlights cutting through the streets, isolated windows glowing, a distant urban hum. But on this morning, nothing. The skyline is gone, swallowed by absolute black. No outlines of high-rises, no horizon glow. Streets below rely on flashlight beams and the occasional car headlight. The usual city noise? Replaced by an eerie quiet, broken only by footsteps and murmured voices.

    This isn’t new territory entirely. Rolling blackouts have hit Kyiv hard since June 2024, with some periods stretching to 10-12 hours a day. Residents adapt, timing their lives around power schedules. Yet this scale feels different. Total. The darkness presses in, mixing disorientation with a strange resilience—folks fire up generators, light candles, charge power banks. No panic, just quiet determination. Still, in that void, time seems to pause. The city feels like it’s slipped out of its normal rhythm, if only for a moment.

    What Kyiv Residents and Remote Watchers Are Describing

    From the ground in Kyiv, accounts paint a picture of entire blocks and high-rises plunged into shadow. People navigate stairwells with phone flashlights, wait for buses under the beams of idling cars. Scooters zip through unlit streets, dodging hazards by instinct. In homes, kids huddle around tablets playing cartoons—the only light piercing the gloom. Families juggle chores and showers during fleeting windows of power, adapting to the unpredictability.

    The war adds its own surreal layer. Witnesses call the missile and drone strikes ‘terrible fireworks’—flashes lighting the sky, then silence as the grid falters. Some report houses tilting or shaking from blasts near dams or key sites, heightening the sense of unreality. Terms like ‘surreal,’ ‘hellish,’ ‘time stops,’ ‘like another world’ crop up repeatedly, echoing phrases from high-strangeness reports, even though these stem from conventional events.

    So far, no overt paranormal claims from locals. But the atmosphere—the glowless skies, the silenced capital—feels uncanny, stirring echoes of old folklore about ominous darkness. Remote watchers, from YouTube analysts to OSINT groups and paranormal circles, track these as part of wider infrastructure strains and cyber patterns, piecing together global threads without locking into one theory.

    Timelines, Strikes, and the Fragile Power Grid

    Ukraine’s energy grid has faced relentless pressure for years, blending cyber incursions with physical bombardments. Damage tallies exceed $11.4 billion since 2022, per the IEA. The system, once boasting 59 GW of capacity in 2021, now grapples with sustained assaults aimed at multiple nodes for cascading failures.

    To track the pattern, here’s a summary of key events:

    Date Type of Attack Scale of Impact Kyiv-Specific Notes
    December 2015 Cyber Outages for over 230,000 residents in Ivano-Frankivsk region, lasting up to six hours N/A (regional focus)
    August 26, 2024 Kinetic (missiles and drones) Over 200 projectiles targeting energy infrastructure, triggering widespread blackouts Contributed to rolling outages in Kyiv
    June 2024 onward Ongoing grid stress from prior attacks 10–12 hour daily outages in some periods Rolling blackouts implemented in Kyiv
    November 17–18, 2024 Kinetic (drones and missiles) Nationwide blackouts affecting millions, at least seven deaths; one wave with 458 drones and 45 missiles Unscheduled outages in Kyiv, first since November 2022

    Operators like Ukrenergo release blackout schedules to manage the strain, but intense strikes can overwhelm them, leading to sudden, city-wide failures.

    Official Storylines and the View from the Dark Streets

    Agencies like CISA attribute events such as the 2015 cyber-attack to Russian state-linked actors. The IEA and Ukrainian officials describe the barrage as a calculated effort to dismantle the energy system, not random mishaps. They point to resilience efforts: published schedules, LED programs, links to European grids, and assurances that total collapse has been averted.

    On the streets, though, it hits differently. When the skyline vanishes and schedules crumble into unscheduled voids, control feels like an illusion. Residents report vulnerability, exposed in the dark. This gap breeds dissonance—official claims of managed duress clash with the lived reality of a lightless city, sparking rumors and deeper scrutiny.

    Some locals and analysts suspect understated cyber elements in recent strikes, possibly fueling glitches or unexplained cascades not detailed publicly. While no official ties to environmental anomalies exist, witnesses mention odd silences, explosion lights, and physical sensations that push beyond basic outages. Even accepting the attacks as Russian-led doesn’t cover every peculiar system quirk or perception.

    When War Edges into High-Strangeness

    What if these blackouts hide subtler layers? Unreported anomalies—unusual lights, electromagnetic quirks, device glitches—that don’t fit standard outage molds? The 2015 hack proved code can ripple into physical chaos; newer ops might blend cyber and kinetic in ways that spawn odd behaviors, undocumented in open sources.

    Ukraine’s grid serves as a hybrid warfare lab: strikes, fixes, reroutes, cross-border ties. In such chaos, side effects could surface—glitches, interference—hard to spot. Culturally, deep darkness in Ukrainian lore signals omens or trauma; a blacked-out capital revives those threads, tinting descriptions.

    Witness words mirror high-strangeness: time warps, vivid flashes in the dark, a world paused. Evidence points squarely to military action and grid wear, not unknowns. Yet the uncanny feel is real, part of the narrative. If this unfolds in a watched warzone, what slips unnoticed elsewhere in failing grids?

    What Nights Like This Might Be Telling Us

    We stand on firm facts: systematic attacks since 2015, escalating to 2022’s hybrid assaults, yielding billions in damage and outages like those in August and November 2024. The described total blackout aligns with unscheduled failures post-strike.

    The simplest read? Wartime targeting and degradation, no exotic tech or phenomena. Still, questions linger: full disclosure on cyber roles and anomalies? Overlooked electromagnetic effects? How darkness narratives influence memory?

    For those tracking unexplained patterns, Kyiv offers a window into colliding worlds—warfare, infrastructure, perception. The weirdness might stem from system failures and human response, not skies or secrets. Listening closely to these accounts, without dismissal or hype, sharpens our view for what’s next—whether from code, conflict, or beyond.

    Frequently Asked Questions

    Yes, residents described an unprecedented total blackout of the skyline, consistent with unscheduled outages following massive Russian strikes, such as those on November 17–18, 2024, which affected millions nationwide.

    Agencies like CISA attribute the 2015 cyber-attack to Russian state-linked actors, while the IEA and Ukrainian officials document ongoing missile and drone strikes since 2022 as deliberate targeting of the energy grid, causing over $11.4 billion in damage.

    No solid evidence points to paranormal causes; the events align with wartime infrastructure attacks. However, the uncanny atmosphere—described as surreal or time-stopping—echoes high-strangeness reports, shaped by psychological and cultural factors.

    Ukrenergo publishes blackout schedules and emphasizes resilience measures like LED programs and European grid connections. Officials maintain that complete collapse has been avoided, framing the situation as managed duress despite the attacks.

    They highlight hybrid warfare’s impact on infrastructure, potentially revealing patterns in system failures and human perception. For those following unexplained events, Kyiv’s blackouts show how conventional crises can produce high-strangeness experiences.

  • Elite Bunkers & UAP Files: What We Aren’t Being Told

    Elite Bunkers & UAP Files: What We Aren’t Being Told

    Key Takeaways

    • The U.S. hit a record 28 billion-dollar weather and climate disasters in 2023, costing around $92.9 billion, while global records from EM-DAT tally over 27,000 mass disasters since 1900, showing crises are routine, not rare—and now the Pentagon and NASA treat UAPs as serious, with 400 incidents tracked and 18 displaying odd flight traits, though they deny extraterrestrial links.
    • Dr. Chris Ellis, a 26-year military veteran and author of “Resilient Citizens: The People, Perils, and Politics of Modern Preparedness,” points to why experts push resilience: rising disasters from climate and infrastructure woes, but he bridges official planning with citizen worries about unchecked risks.
    • Questions linger on elite preparations—bunkers, summits—that might tie into hidden threats, fueled by community reports and whistleblowers suggesting undisclosed UAP-related dangers beyond public knowledge.

    When Preparation Quietly Became a Way of Life

    Picture this: your phone buzzes with another emergency alert, the third this month. Floods in one state, wildfires in another, and social media scrolls past tours of underground bunkers like it’s the new real estate trend. Extreme weather isn’t news anymore; it’s the rhythm of the day. Meanwhile, conferences on ‘resilience’ draw crowds of suits discussing system shocks over catered lunches. Into this scene steps Dr. Chris Ellis, not as some wild-eyed survivalist, but a seasoned pro with 26 years in the military, an expert in disaster preparedness, and author of “Resilient Citizens: The People, Perils, and Politics of Modern Preparedness.” He’s seen the models, planned the responses. And yet, behind the scenes, luxury bunkers rise, elite summits whisper about breakdowns, and you can’t shake the feeling that the preparations go deeper—modeling threats that stay locked in classified rooms. The signs stack up: 28 billion-dollar disasters in the U.S. in 2023 alone, the highest ever, hitting every few weeks on average from 2018 to 2022. Globally, EM-DAT has logged over 27,000 mass disasters since 1900. Institutions have been tracking this for decades. Something has shifted, and it’s not just the weather.

    What People Say the Planners Aren’t Telling Us

    Those tuned into the edges of the story—observers, researchers, and folks sharing reports in forums—see patterns that official channels sidestep. First, there’s the clear concern over climate chaos, crumbling infrastructure, and global tensions ratcheting up. Witnesses and analysts point to elites snapping up doomsday bunkers and remote compounds, reading it as prep for society-wide disruptions. Then come the suspicions around UAPs and possible non-human intelligences. Whistleblower accounts, like those in documentaries such as “The Age of Disclosure,” describe decades of government cover-ups, with insiders allegedly briefed on risks that could upend everything—encounters that hint at existential threats kept from the public eye. Military witnesses in the UAP conversation report consistent oddities: objects pulling maneuvers that defy physics, popping up near nukes or bases, and a hunch that top briefings hold the real bombshells, far beyond the sanitized reports. Broader still, some argue ‘resilience’ talk among the powerful is code for bracing against shocks—from climate collapses to financial meltdowns or even contact with something otherworldly. In online discussions and interviews, people connect the dots: spiking disaster stats alongside official UAP scrutiny, seeing it as evidence of converging crises that elites anticipate but don’t fully share.

    Storm Counts, Databases, and Declassified Skies

    Let’s ground this in the numbers that can’t be argued away. NOAA data shows the U.S. faced 28 billion-dollar weather and climate disasters in 2023, breaking the 2020 record of 22, with losses at $92.9 billion. From 2018 to 2022, these events averaged one every 18 days, making rare catastrophes feel routine. EM-DAT, pulling from UN and NGO sources, has cataloged over 27,000 mass disasters worldwide since 1900, proving these aren’t new inventions—just more visible now. On the UAP front, the Pentagon’s 2021 report examined 144 military-reported incidents, with 18 exhibiting bizarre traits like extreme maneuverability or ignoring aerodynamics. By 2022, their database held around 400 cases, enough to demand structured tracking. NASA joined in June 2022, forming an independent study team that went public in May 2023, pulling the topic from the fringes into science’s spotlight. What’s documented is real: disasters are climbing, UAP reports are piling up. What’s acknowledged officially stops short of exotic explanations. The rest? That’s where speculation fills the gaps.

    Metric Value
    U.S. Billion-Dollar Disasters (2023) 28
    Total Costs (2023) $92.9 billion
    EM-DAT Total Events (1900-Present) Over 27,000
    Pentagon UAP Incidents (2022 Database) Around 400
    UAP Cases with Unusual Characteristics (2021 Report) 18

    Reassurance, Risk Models, and the Gaps in the Story

    Institutions paint one picture; the community sees another, shadowed by what’s left unsaid. Take disasters: NOAA and FEMA tie the surge to climate shifts, old grids, and development choices, pushing practical fixes like better codes and flood plans. They frame it as tough but tackleable, no doomsday vibes. UAPs get similar treatment—the Pentagon’s AARO and task forces call them real security issues, worth probing, but pin most on glitches, drones, or balloons, with zero confirmed alien tech. NASA’s team echoes that, betting on mundane answers while admitting some data warrants the effort. Yet community voices read these steps—new offices, studies—as a slow reveal, dripping out truth to soften the blow of bigger revelations. If elites are fortifying against black swans, researchers say, it could mean internal models factor in wild cards like sudden climate flips or non-human contacts, rarely aired publicly. Dr. Chris Ellis, with his military background and book on preparedness, offers insight here. He knows how pros rank threats: everyday floods high on the list, rare cataclysms lower but still planned for. Politics shapes what’s shared—officials aren’t all deceivers, citizens aren’t all alarmists. It’s about access, incentives, and the trust eroding between them.

    Living in the Space Between Warnings and Whispers

    The threads weave together: disasters spiking, with U.S. records broken and EM-DAT’s 27,000-plus events proving the pattern; UAPs now tracked by the military (400 incidents) and NASA, yet officials stick to no-ET verdicts, leaving those 18 weird cases as tantalizing unknowns. Elite resilience culture—bunkers, private drills—hints at more, though no hard proof ties it to high-strangeness like alien incursions. We know planning often hides low-odds, high-stakes scenarios from view, shaped by power plays. So the questions hang: Are leaders just prepping for the obvious—climate, grids, wars—or factoring in classified intel on non-humans or anomalies? How could we tell? Dr. Ellis’s work reminds us: build your own resilience, stay sharp on info, push for openness. Whatever’s coming, curiosity and readiness beat waiting in the dark.

    Frequently Asked Questions

    The U.S. experienced a record 28 billion-dollar weather and climate disasters in 2023, costing $92.9 billion, per NOAA. Globally, EM-DAT has recorded over 27,000 mass disasters since 1900, indicating these events are frequent and their tracking has grown more intensive.

    The Pentagon tracks around 400 UAP incidents, with 18 from the 2021 report showing unusual traits, but attributes most to conventional explanations without confirming extraterrestrial origins. NASA formed a study team in 2022, holding public meetings to analyze the phenomena scientifically.

    Many see elites building bunkers and attending resilience summits as signs of prep for undisclosed risks, possibly linked to UAPs or non-human intelligences, based on whistleblower claims and patterns in reports. This contrasts with official focuses on climate and infrastructure without mentioning speculative threats.

    Dr. Chris Ellis is a 26-year military veteran and disaster preparedness expert, author of “Resilient Citizens: The People, Perils, and Politics of Modern Preparedness.” He bridges institutional risk planning with citizen concerns, explaining how politics influences what threats are publicly discussed.

    Official reports from the Pentagon and NASA state there is no confirmed evidence of extraterrestrial origins for UAPs, often citing misidentifications or sensor errors. However, community interpretations and whistleblowers suggest deeper, undisclosed information may exist.

  • Solar Flares vs Airbus Jets: The Vulnerability Gap

    Solar Flares vs Airbus Jets: The Vulnerability Gap

    Key Takeaways

    • A powerful recent X-class flare (around X1.9 in intensity) erupted as new active regions rotated into view, in the context of Solar Cycle 25 already outperforming early forecasts in terms of activity.
    • On December 31, 2023, an X5.0 solar flare — the strongest since 2017 — was recorded by NASA’s Solar Dynamics Observatory, showing that high-end flares are already on the table this cycle.
    • In November 2025, Airbus issued a precautionary alert affecting roughly 6,000 A320-family aircraft, saying intense solar radiation could corrupt flight control data and mandating a software update that takes 2–3 hours per plane.
    • NASA and NOAA acknowledge that Solar Cycle 25 is stronger than initially projected, with increased chances of geomagnetic storms that can disrupt satellites, power grids, and aviation — but agencies describe these as manageable, monitored risks.
    • Independent analysts and communities following geophysicist Stefan Burns connect the Airbus vulnerability and recent flares to a broader pattern: modern systems becoming increasingly brittle under rising solar stress, with potentially cascading effects on infrastructure.
    • Unresolved questions include whether a specific flare exposed the Airbus flaw, how far this vulnerability pattern extends into other sectors (power, internet, navigation), and whether official reassurances are keeping pace with the actual systemic risk.

    Under a Restless Sky: The Day the Sun Spiked and Jets Went Quiet

    Imagine the Sun unleashing a burst of energy, a massive X-class flare exploding from its surface, captured in stark detail by NASA’s Solar Dynamics Observatory. This wasn’t some distant cosmic event—it was recent, around X1.9 in strength, emerging from a fresh active region as our star ramped up its fury.

    Flash back to December 31, 2023: an X5.0 flare, the most potent since 2017, ripped across space, a clear signal that Solar Cycle 25 means business.

    Months later, the fallout hits closer to home. Airlines worldwide pull thousands of Airbus A320-family jets for urgent software updates. The bulletin warns of intense solar radiation potentially corrupting flight control data. It’s all done quietly—no fanfare, no passenger alerts.

    Board a flight, and everything seems fine. The plane gleams under airport lights. But behind the scenes, a patch is applied to shield against an invisible threat from above.

    Is this just routine maintenance? Or the first sign that our tech-driven world is cracking under pressure from a star that‘s only getting started?

    What Pilots, Researchers, and Watchers of the Sun Are Saying

    In aviation forums, pilots share stories of odd in-flight glitches on A320-family jets—sudden altitude shifts, autopilot quirks—that seem to align with spikes in solar activity.

    Some point to specific cases, like a JetBlue A320 dropping altitude unexpectedly, wondering if solar radiation spikes played a role, though no official links confirm it.

    Geophysicist Stefan Burns draws a crowd on YouTube, linking solar flares and geomagnetic storms to Earth changes. He covers tech disruptions, possible earthquake ties, even shifts in human consciousness. Not everyone buys the speculative side, but many value his take on solar activity’s wide-reaching effects.

    Critics say he blends hard science with spiritual angles, yet supporters argue he spotlights connections mainstream sources overlook.

    Solar watchers monitor flares, sunspots, and storm alerts in real time. They correlate these with auroras, power glitches, GPS issues, and personal effects like headaches or sleep troubles. Practices like ‘earthing’ gain traction during storms.

    At the heart of it: the Airbus issue isn’t just a bug. It’s a symptom of systems designed for milder space weather, now tested by a fiercer solar cycle.

    Timelines, Flares, and the Airbus Recall We Can Actually Document

    Solar Cycle 25 kicked off in 2019. NASA and NOAA now say it’s outperforming predictions, with a peak expected between January and October 2024.

    The December 31, 2023 X5.0 flare peaked at 21:55 UTC, logged by NASA’s Solar Dynamics Observatory— the strongest X-class since 2017.

    NOAA’s Space Weather Prediction Center flags risks to satellites, radios, GPS, aviation, and power, but stresses these are part of the cycle.

    On November 28, 2025, Airbus alerted on a vulnerability in about 6,000 A320-family aircraft. Intense solar radiation could corrupt flight data, requiring a 2–3 hour software update per plane.

    Airbus called it precautionary, not tied to a disaster. EASA issued directives to enforce the fixes, showing real concern beneath the calm.

    Date Event
    2019 Start of Solar Cycle 25
    Dec 31, 2023 X5.0 flare
    2024 Forecast peak window for Solar Cycle 25
    Nov 28, 2025 Airbus A320 software alert, affecting ~6,000 aircraft

    What Officials Say Is Under Control—and What the Patterns May Be Telling Us

    NASA and NOAA report Solar Cycle 25 as more active than expected, raising odds of geomagnetic storms that hit tech. They stress monitoring and protocols keep things in check for satellites, grids, and flights.

    The 2023 X5.0 flare? Serious, but expected. Officials frame disruptions as operational hurdles, not crises.

    Alternative analysts see it differently: a volatile Sun clashing with our reliance on fragile electronics, satellites, and automated aircraft.

    Airbus describes the A320 flaw as a design oversight in data handling under rare radiation, fixed routinely—no direct link to a specific flare admitted.

    Yet communities suspect anomalies during solar events prompted the recall, even if unspoken.

    Aviation might be the tip. What about grids, cables, logistics, trading, or nuclear safeguards in a big storm? Historical hits like the 1989 Quebec blackout or 1859 Carrington event back the worry.

    Some of Burns’ ideas stretch beyond science, but the core—solar stress on systems—holds. Officials talk probabilities; watchers see patterns of quiet fixes signaling deeper fragility.

    Living in a Solar Engine Room: What It All Might Mean

    We know this much: a major X5.0 flare in late 2023, a lively Solar Cycle 25, agency warnings on tech impacts, and Airbus’ radiation-linked software fix for thousands of jets.

    What’s unclear: did a particular event uncover the flaw? How many other incidents get chalked up to space weather privately? Where do failures cascade?

    Observers aren’t overreacting. They’re questioning if our tech assumes a tamer space than reality delivers.

    Burns’ interconnected view, speculative or not, highlights risks in our linked infrastructure.

    We’ve tied our world to this star via tech. The Airbus case peels back the veil: not on solar danger, but on our own brittleness. Track the flares, recalls, advisories. Demand evidence from all sides, and face the unknowns head-on.

    Frequently Asked Questions

    The article notes unresolved questions about whether a particular flare or geomagnetic storm exposed the flaw. Airbus framed the alert as precautionary, without admitting a direct trigger from an event like the December 31, 2023 X5.0 flare. Community discussions suggest possible links to in-flight anomalies during solar spikes, but no official confirmation exists.

    NASA and NOAA state that Solar Cycle 25 is stronger than initially projected, with a higher chance of geomagnetic storms affecting technology. They describe these as manageable risks through monitoring and mitigation. Events like the 2023 X5.0 flare are seen as expected, not existential threats.

    Analysts like Stefan Burns and solar watchers connect the Airbus vulnerability to systemic fragility in infrastructure, including power grids, internet, and navigation. They argue modern systems are brittle under rising solar stress, potentially leading to cascading effects. This contrasts with official views by emphasizing interconnected vulnerabilities beyond aviation.

    Airbus issued the November 2025 alert as a precaution for intense solar radiation corrupting flight data, affecting about 6,000 A320-family aircraft. Communities suspect real-world anomalies or clusters during solar activity forced the software update, though officials don’t connect specific dots. The update takes 2–3 hours per plane and was mandated by regulators like EASA.

    Discussions in aviation forums report in-flight glitches like altitude deviations coinciding with solar spikes. Historical events, such as the 1989 Quebec blackout and 1859 Carrington event, show solar storms’ real impacts. Independent tracking of flares and anomalies builds a pattern of tech stress, even if speculative elements like consciousness shifts remain unproven.

  • AI Music on the Charts: Inside the Occult Frequency War

    AI Music on the Charts: Inside the Occult Frequency War

    Key Takeaways

    • An AI-generated song topped a major Billboard chart in November 2024, marking a quiet shift where machine-made music blends seamlessly into daily listening.
    • Studies show about one-third of new songs uploaded daily are AI-created, with 97% of listeners unable to distinguish them from human work, raising questions about emotional authenticity.
    • Alternative researchers point to sacred geometry in music’s math, suggesting AI might tap into the same frequency realms mystics have explored, without human soul or intent.
    • Official narratives focus on tech and markets, while occult circles see a deeper battle over consciousness through sound.

    What This Wave of AI Music Might Really Be Tuning Us Into

    AI music has surged into the mainstream, claiming spots on charts and playlists without most people noticing. Listeners often can’t spot the difference, but some wonder if these tracks pull from deeper, less tangible sources—pure algorithms or something echoing ancient occult practices where sound unlocked hidden dimensions.

    • Breaking Rust’s AI-generated “Walk My Walk” hit #1 on Billboard’s Country Digital Song Sales chart in November 2024, one of the first times a fully artificial act topped a major category.
    • A 2024 Deezer study estimates one-third of daily music uploads—around 50,000 songs—are AI-made, with 97% of listeners unable to reliably tell them apart from human creations.
    • Questions persist about the spiritual angle: music’s mathematical foundations, like Pythagorean tuning and sacred geometry, might let AI mimic the frequency realms mystics accessed, but without the human discernment that guided those traditions.

    The Night an Invisible Artist Topped the Charts

    Picture a quiet evening in November 2024. You’re behind the wheel, cruising under streetlights, or sweating through a gym session with earbuds in. A country track kicks in—raw, heartfelt, the kind that sticks. “Walk My Walk” by Breaking Rust. It climbs to #1 on Billboard’s Country Digital Song Sales chart. But Breaking Rust isn’t a band of road-worn musicians; it’s an AI project, entirely generated by code.

    The airwaves feel different now. Playlists on Spotify or Apple Music autoplay endlessly, feeding you songs that hit just right. Yet around 50,000 AI tracks flood platforms daily, per a 2024 Deezer study—about a third of all new uploads. Millions sync their emotions to these ghost artists, algorithms deciding what authenticity sounds like. It’s eerie, this hidden broadcast shaping the mood of crowds, all from behind glowing screens. And at its core? Numbers in motion, geometry you can hear, hinting at forces beyond the code.

    What Listeners, Producers, and Esoteric Researchers Are Saying

    In music forums, occult groups, and alternative tech circles, people share stories that cut through the noise. Listeners describe AI songs as oddly familiar—convincing on the surface, stirring real feelings, but sometimes leaving a hollow aftertaste, like perfection without depth.

    Deezer’s 2024 tests back this up: only 3% of participants could consistently spot AI tracks, yet some report a subtle drain after prolonged exposure, a ‘tuning down’ that fatigues the psyche rather than lifting it.

    Esoteric voices frame music as ritual tech. Pythagorean ratios, the 3:2 perfect fifth, and tunings like 432 Hz align with sacred geometry and Fibonacci patterns, seen as keys to higher dimensions. Theorists argue AI scrapes these same structures, generating tracks that echo mystic practices but lack human soul or ethical boundaries.

    Producers like Rick Rubin embody this lineage—he’s called a secular magician, relying on meditation and altered states to channel ‘otherworldly’ material, bypassing traditional skills.

    This ties into historical threads: Jimmy Page’s Crowley collections and Thelemic sigils, or Coil’s albums as magical workings. Rumors swirl of a ‘new Aleister Crowley’ advising modern producers and AI teams, though unverified—it’s more a nod to occult undercurrents persisting in music.

    Numbers, Ratios, and the Digital Ghost in the Machine

    Let’s ground this in what’s verifiable. In November 2024, Billboard confirmed Breaking Rust’s “Walk My Walk” as the first purely AI act to top the Country Digital Song Sales chart.

    Deezer’s study adds weight: one-third of daily uploads—50,000 tracks—are AI-generated, and 97% of listeners couldn’t identify them in tests.

    Metric Detail
    First AI #1 Chart November 2024, “Walk My Walk” by Breaking Rust
    Daily AI Uploads ~50,000 (one-third of total)
    Detection Rate Only 3% can reliably distinguish AI from human

    Research on platforms like ResearchGate and Gaia details music’s math: Pythagorean tuning uses integer ratios, the 3:2 fifth connects to geometric forms, and 432 Hz is pitched as a ‘natural’ alignment, though debated. Peer-reviewed papers confirm the structures but steer clear of spiritual leaps.

    Rick Rubin has shared in interviews his use of meditation for creative access, describing it as tapping otherworldly states. Crowley’s influence shows in sourced histories—his motto on albums, Page’s artifacts, Coil’s rituals.

    Anthropic’s Claude AI has drawn attention too, drifting into ‘spiritual bliss’ language in interactions, per reports. Labs call it training data echo, but the parallel to mystic speech stands out.

    The Official Story and the Shadow Narrative

    Mainstream outlets like Billboard view AI breakthroughs as market quirks—Breaking Rust and acts like Xania Monet spark talks on ethics and pay, not metaphysics.

    Deezer and Euronews highlight confusion: 97% can’t tell AI apart, risking fraud, but frame it as a tech issue, not a spiritual one. Academic work breaks it down to spectrograms and models, treating geometry as math, not gateways.

    Anthropic dismisses Claude’s mystical turns as data patterns, denying any real consciousness.

    Alternative perspectives clash here. If music’s ratios were mystic tools, AI scaling them up might blindly channel frequencies, amplifying states without intent. Occult circles see it as accessing a shared field—the Akashic or ether—like Rubin or Crowley did, but mechanized.

    Some invoke biblical ‘lying wonders,’ imitations steering consciousness toward passivity. Both sides agree music shifts mood and focus; the split is whether it’s brain chemistry or external spiritual terrain.

    Into the Mathematical Ether: Are We Tuning Ourselves, or Being Tuned?

    What if AI, built on Pythagorean ratios and harmonic math, stumbles into the frequency spaces sacred traditions mapped? Even if unintended, could it simulate those alignments?

    And does the distinction matter? If listeners feel real shifts—trance, vulnerability—the impact hits the same, simulated or not.

    Rumors of a ‘new Crowley’ in producer and AI circles lack proof, likely echoing a broader occult-tech Revival.

    In spiritual genres, can AI convey true devotion, or does it flatten it to empty imitation? Claude’s bliss talk mirrors human longing, a loop of input and output.

    No major studies probe these metaphysical edges; research sticks to commerce and psychology, leaving ritual AI design or frequency tests as open frontiers.

    Tuning Forks at the Edge of a New Era

    We know AI topped charts in 2024, with a third of new tracks machine-made and nearly indistinguishable. Music’s geometry ties to ancient sacred patterns.

    Institutions call it tech disruption; alternative views see mechanized access to otherworldly spaces, building on Rubin’s channeling and Crowley’s legacy.

    At stake: who’s directing human inner worlds through sound? Check your reactions—does algorithmic music leave you drained or alive? Opt for human-intended tracks and see what shifts.

    We’re peering into how code intersects with sound’s invisible architectures, a mystery unfolding without easy answers.

    Frequently Asked Questions

    Yes, in November 2024, the AI-generated song “Walk My Walk” by Breaking Rust reached #1 on Billboard’s Country Digital Song Sales chart. This marked one of the first times a fully artificial project topped a major category, as reported by Billboard.

    A 2024 Deezer study estimates about 50,000 AI-generated songs are uploaded daily, making up one-third of new music on platforms. In tests, 97% of listeners couldn’t reliably distinguish AI tracks from human-made ones, though some report a subtle ‘hollow’ quality after extended listening.

    Alternative researchers note that music’s mathematical structures, like Pythagorean ratios and 432 Hz tuning, align with sacred geometry and Fibonacci patterns, historically seen as spiritual gateways. They argue AI recombines these same elements, potentially mimicking mystic frequencies without human intent.

    Official narratives from Billboard and AI labs frame it as technical pattern-matching and market changes, rejecting spiritual aspects. In contrast, occult communities see AI as amplifying ritual-like frequencies, possibly part of a consciousness shift, drawing parallels to figures like Rick Rubin and Aleister Crowley.

    Verified histories show Crowley’s impact on artists like Jimmy Page and Coil, who used ritual elements. Producers like Rick Rubin describe meditative channeling, and AIs like Claude have shown mystical language patterns, though labs attribute this to training data.