Category: UFO & Aliens

  • 3I/ATLAS & GRB 250702B: Coincidence or Cosmic Signal

    3I/ATLAS & GRB 250702B: Coincidence or Cosmic Signal

    Key Takeaways

    • On July 1, 2025, at 05:15:11 UT, the ATLAS telescope in Chile discovered interstellar comet 3I/ATLAS (C/2025 N1) at coordinates RA 18:07:27.68 (≈271.865°), Dec −18:41:40.2 (J2000), as reported in MPEC, arXiv, and MPC sources.
    • Roughly 24 hours later, on July 2, 2025, at 13:56:05 UT, Fermi GBM detected GRB 250702B, localized to RA 286.0°, Dec −8.7° (J2000) with ≈7.8° uncertainty; this ultra-long burst lasted over seven hours with repeated pulses, per Fermi GCN and arXiv.
    • The core tension lies in the 17° angular separation between the comet’s discovery position and the GRB localization, JWST’s redshift placing the GRB at z ≈ 1.036 in a distant galaxy, and Einstein Probe’s stacked X-ray activity starting July 1—raising questions of coincidence or deeper links despite the extragalactic evidence.

    The Night the Sky Picked a Story

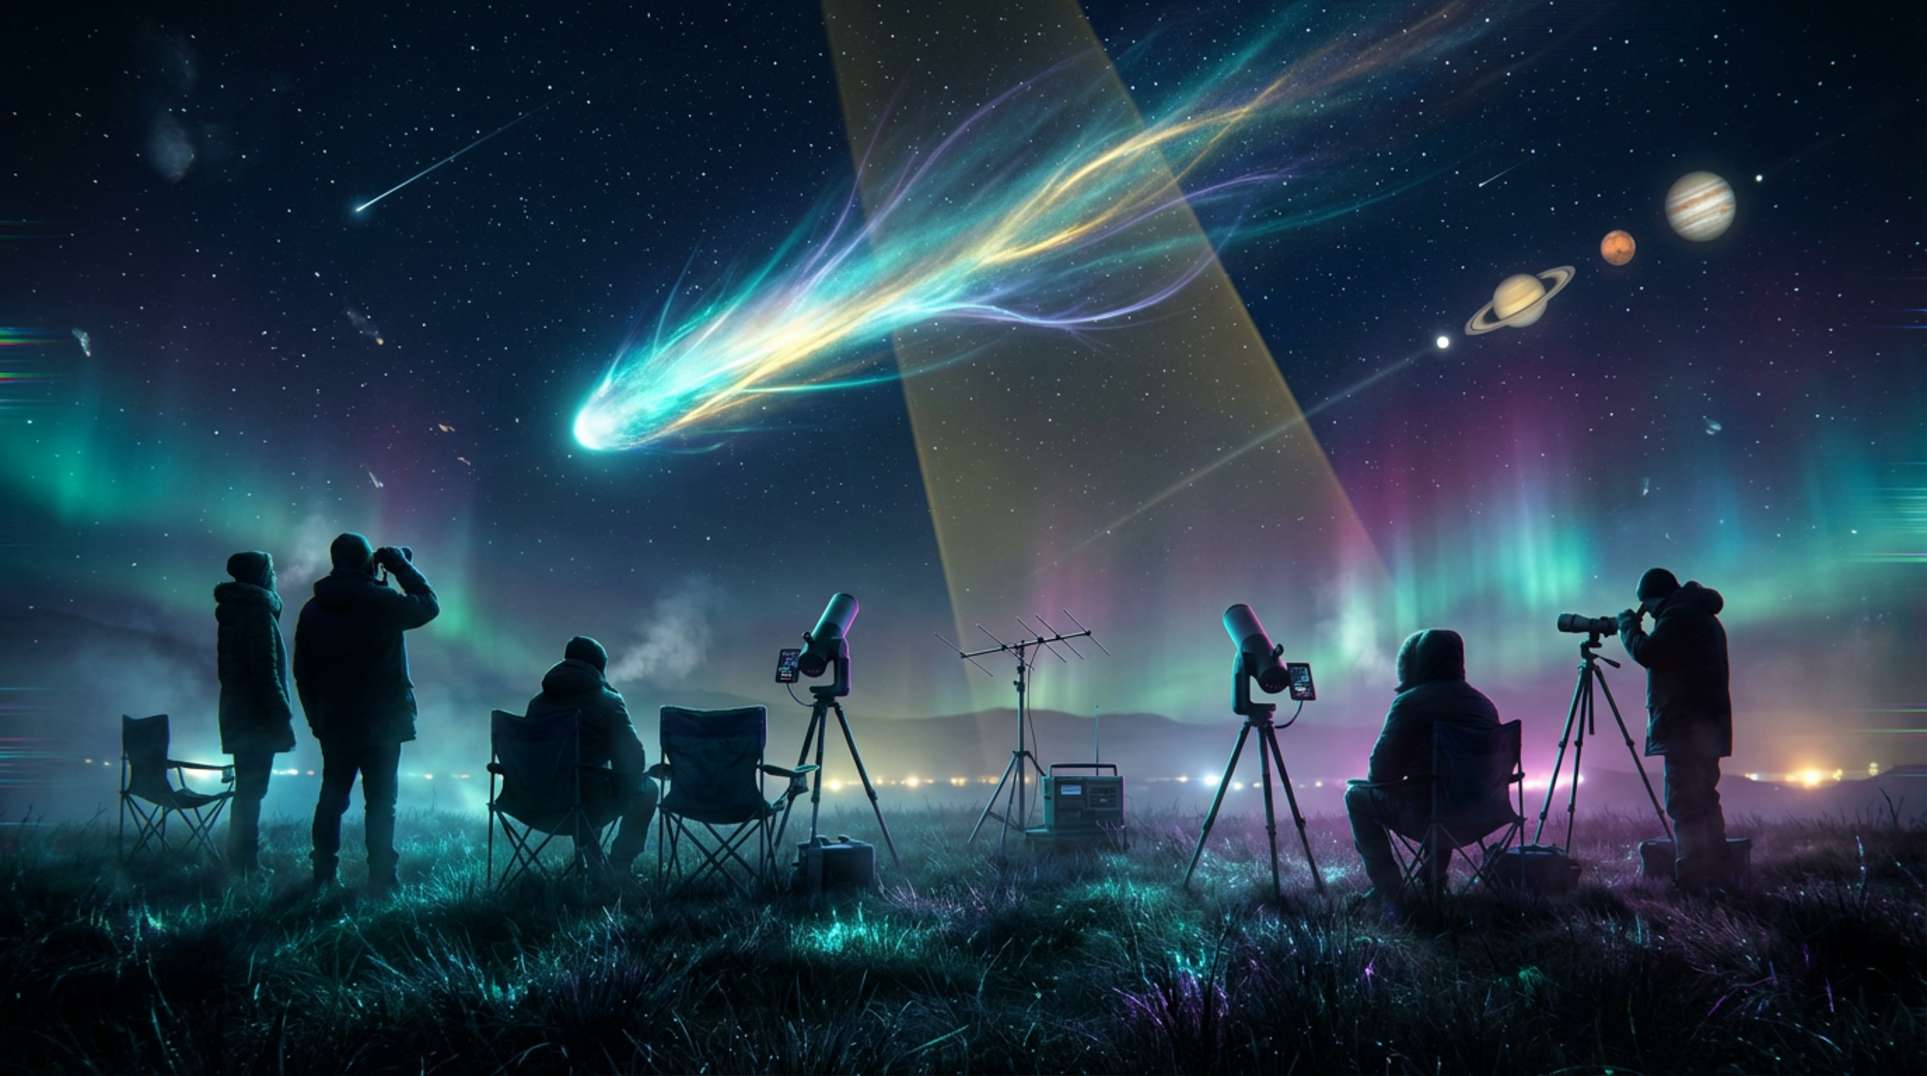
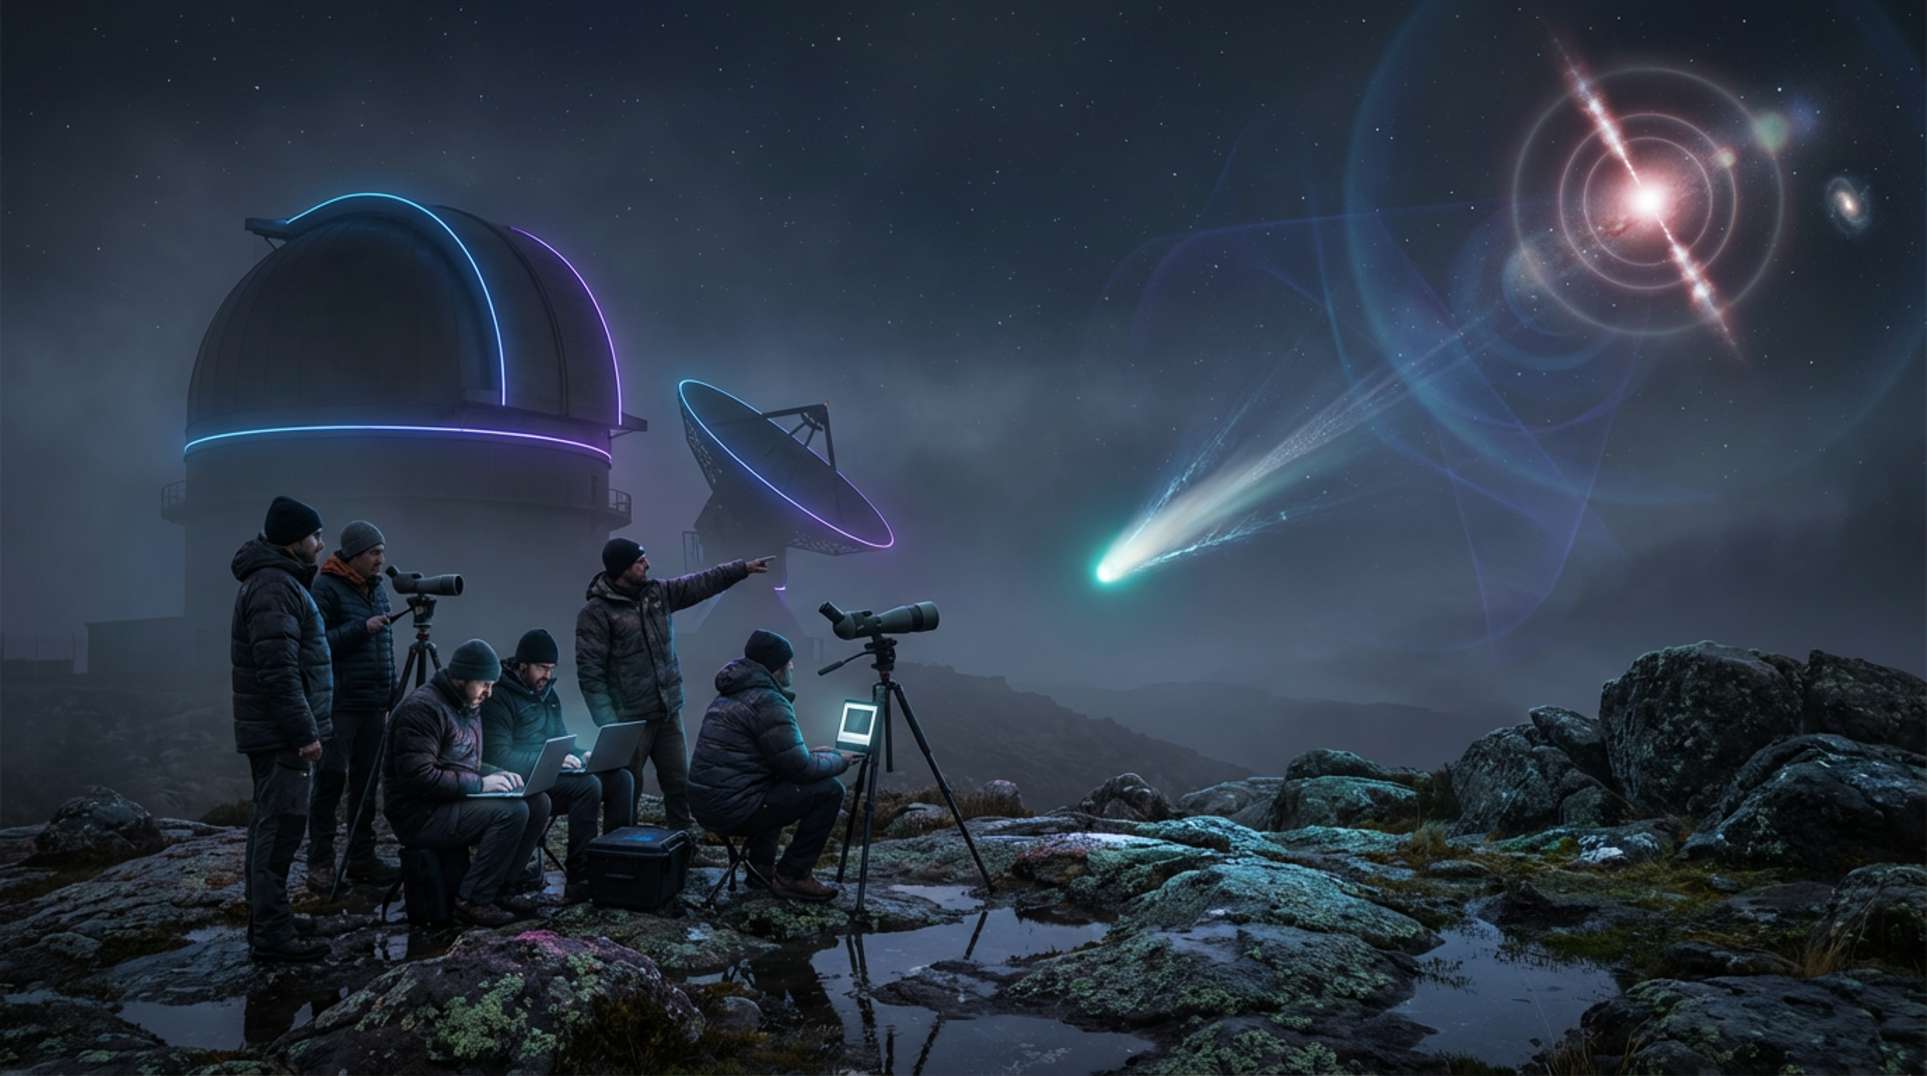
    Picture early July 2025, the air still crisp before dawn in Chile as the ATLAS telescope captures its frames. Satellites like Fermi and Einstein Probe scan the heavens for high-energy flashes, while ground observers and online communities hold their breath. Then, within a day, two events unfold: the spotting of interstellar comet 3I/ATLAS darting through our Solar System, and GRB 250702B erupting from a galaxy at redshift z ≈ 1.036, billions of light-years away.

    The scale clashes— one a visitor in our cosmic backyard, the other a distant explosion. Yet the timing sparks immediate talk. Geophysicist Stefan Burns and others on YouTube call it ‘cosmic synchronicity,’ pointing to the overlap as something more than random. Forums buzz with chatter, blending awe and analysis. It feels uncanny, like the universe aligning signals just for those watching closely.

    What Witnesses and Independent Analysts Report

    In the community, voices like Stefan Burns highlight the same-day timing as a key thread. He notes the Einstein Probe’s stacked X-ray signals kicking off around July 1, tying it to solar and geomagnetic patterns. \”This isn’t coincidence,\” Burns says in his updates. \”We’re seeing energetic coupling—perhaps the comet acting as a receiver amid broader solar activity.\”

    Reddit threads and niche forums echo this, with users amplifying the temporal proximity. Some mix it up, treating the overlap as positional too, while others push back. Claims range from ‘activation’ of the comet by cosmic forces to directed energy or interstellar objects as magnets for events like CMEs. Supporters share sky maps and call for more observations, framing it as synchronicity worth tracking.

    Critics in these spaces urge caution, but the tone stays collaborative. Analysts point to heliophysics data for patterns, leaving room for causal narratives without forcing them. It’s a shared hunt for meaning, grounded in reports and personal interpretations.

    Timelines, Tracks, and Hard Data

    Let’s lay out the facts straight from the records. The discovery of 3I/ATLAS came first, followed by the GRB trigger. Coordinates show a separation of about 17°, calculated from the comet’s position (RA ≈271.865°, Dec −18.694°) and the GRB’s localization (RA 286.0°, Dec −8.7°). This isn’t a tight match—more like an order-of-magnitude gap.

    GRB 250702B stands out for its ultra-long duration, over seven hours with repeated pulses. JWST’s NIRSpec pinned its host galaxy at z ≈ 1.036. Einstein Probe’s WXT stacking caught X-ray activity from July 1, but spatial checks against refined localizations are needed.

    Event Time (UT) Coordinates (J2000) Details Source
    3I/ATLAS Discovery 2025-07-01 05:15:11 RA 18:07:27.68 (≈271.865°), Dec −18:41:40.2 Interstellar comet MPEC / arXiv / MPC
    Fermi GBM Trigger (GRB 250702B) 2025-07-02 13:56:05 RA 286.0°, Dec −8.7° (uncertainty ≈7.8°) Ultra-long, >7 hours, repeated pulses Fermi GCN 40883 / arXiv
    JWST Redshift N/A N/A Host galaxy z ≈ 1.036 arXiv / JWST paper
    Einstein Probe X-ray Starting ~2025-07-01 Stacked signal Pre-activity detection Einstein Probe GCN / stacking analysis

    For visuals, check interactive ephemerides online. A sky map overlay with the comet’s point, the GBM uncertainty circle, and notes on X-ray refinements (like from Swift/XRT or Chandra) would clarify this—links in sources below.

    Official Story vs. What the Data Suggests

    Agencies like ATLAS, MPC, and NASA describe 3I/ATLAS as a standard interstellar comet, with published trajectories. Fermi’s GCN and follow-ups frame GRB 250702B as an extragalactic event, backed by JWST’s redshift and multiwavelength data from Swift, Chandra, and radio scopes.

    They keep them separate for solid reasons: that 17° separation and the GRB’s cosmological distance rule out causal ties under known physics. No overlap in space or time scales.

    Community takes run differently, stressing the same-day hits and Einstein Probe’s July 1 X-rays. Some invoke energetic coupling or directed CMEs, cross-referencing heliophysics catalogs for support—though much stays speculative. Gaps persist: early GBM localizations lack precision, and stacked signals need matching to arcminute X-ray positions. Statistically, rare events coincide by chance sometimes—how often is worth calculating.

    What It All Might Mean

    The data confirms both events: 3I/ATLAS as a Solar System visitor, GRB 250702B as a far-off burst. Positional and redshift evidence points to no physical link.

    Still, questions linger. Does the Einstein Probe signal align spatially with the GRB or comet? Could systematics explain the pre-activity? What’s the odds of such timing by chance alone?

    Readers, consider overlays and probability checks. Seek refined X-ray data from Swift or Chandra against the comet’s path. We’ll chase quotes from the teams. In the end, rigor matters, but so does the pull of synchronicity— that sense of patterns whispering across the void. Stay curious; the sky might have more to say.

    Frequently Asked Questions

    ATLAS discovered interstellar comet 3I/ATLAS early on July 1. About 24 hours later, Fermi detected GRB 250702B, an ultra-long gamma-ray burst. Community notes the timing, while data shows a 17° separation and extragalactic origin for the GRB.

    Angular separation and JWST redshift suggest no physical link. However, Einstein Probe’s X-ray activity from July 1 fuels community ideas of synchronicity or coupling. Spatial cross-checks are needed to clarify.

    Agencies treat them as unrelated: the comet as a Solar System object, the GRB as distant. Follow-ups support an extragalactic source, dismissing causal ties due to distance and physics.

    Voices like Stefan Burns point to temporal overlap and X-ray pre-activity as patterns. Frames include energetic coupling or synchronicity, drawing from solar data and personal analysis.

    Refined X-ray localizations compared to the comet’s ephemeris. Probability calculations for random overlaps. More observations could resolve ambiguities.
  • Solar Storms and Orbs: Coincidence or Real Connection?

    Solar Storms and Orbs: Coincidence or Real Connection?

    Key Takeaways

    • Solar Cycle 25 hit its maximum phase, as announced by NASA and NOAA on October 15, 2024, with warnings of higher rates of solar flares, coronal mass ejections, and space-weather effects from NOAA’s Space Weather Prediction Center.
    • Instrumented studies confirm extreme geomagnetic activity in 2024, including severe to extreme G4-G5 storms in May, backed by peer-reviewed analysis from the American Geophysical Union.
    • Eyewitness and investigator communities note a rise in orb and plasmoid sightings from 2023 to 2025 via sources like NUFORC, MUFON, and Reddit, though these lack instrumentation; questions linger on whether this stems from real causation or just reporting bias, without multi-sensor field confirmations.

    A Quiet Night, an Electric Sky

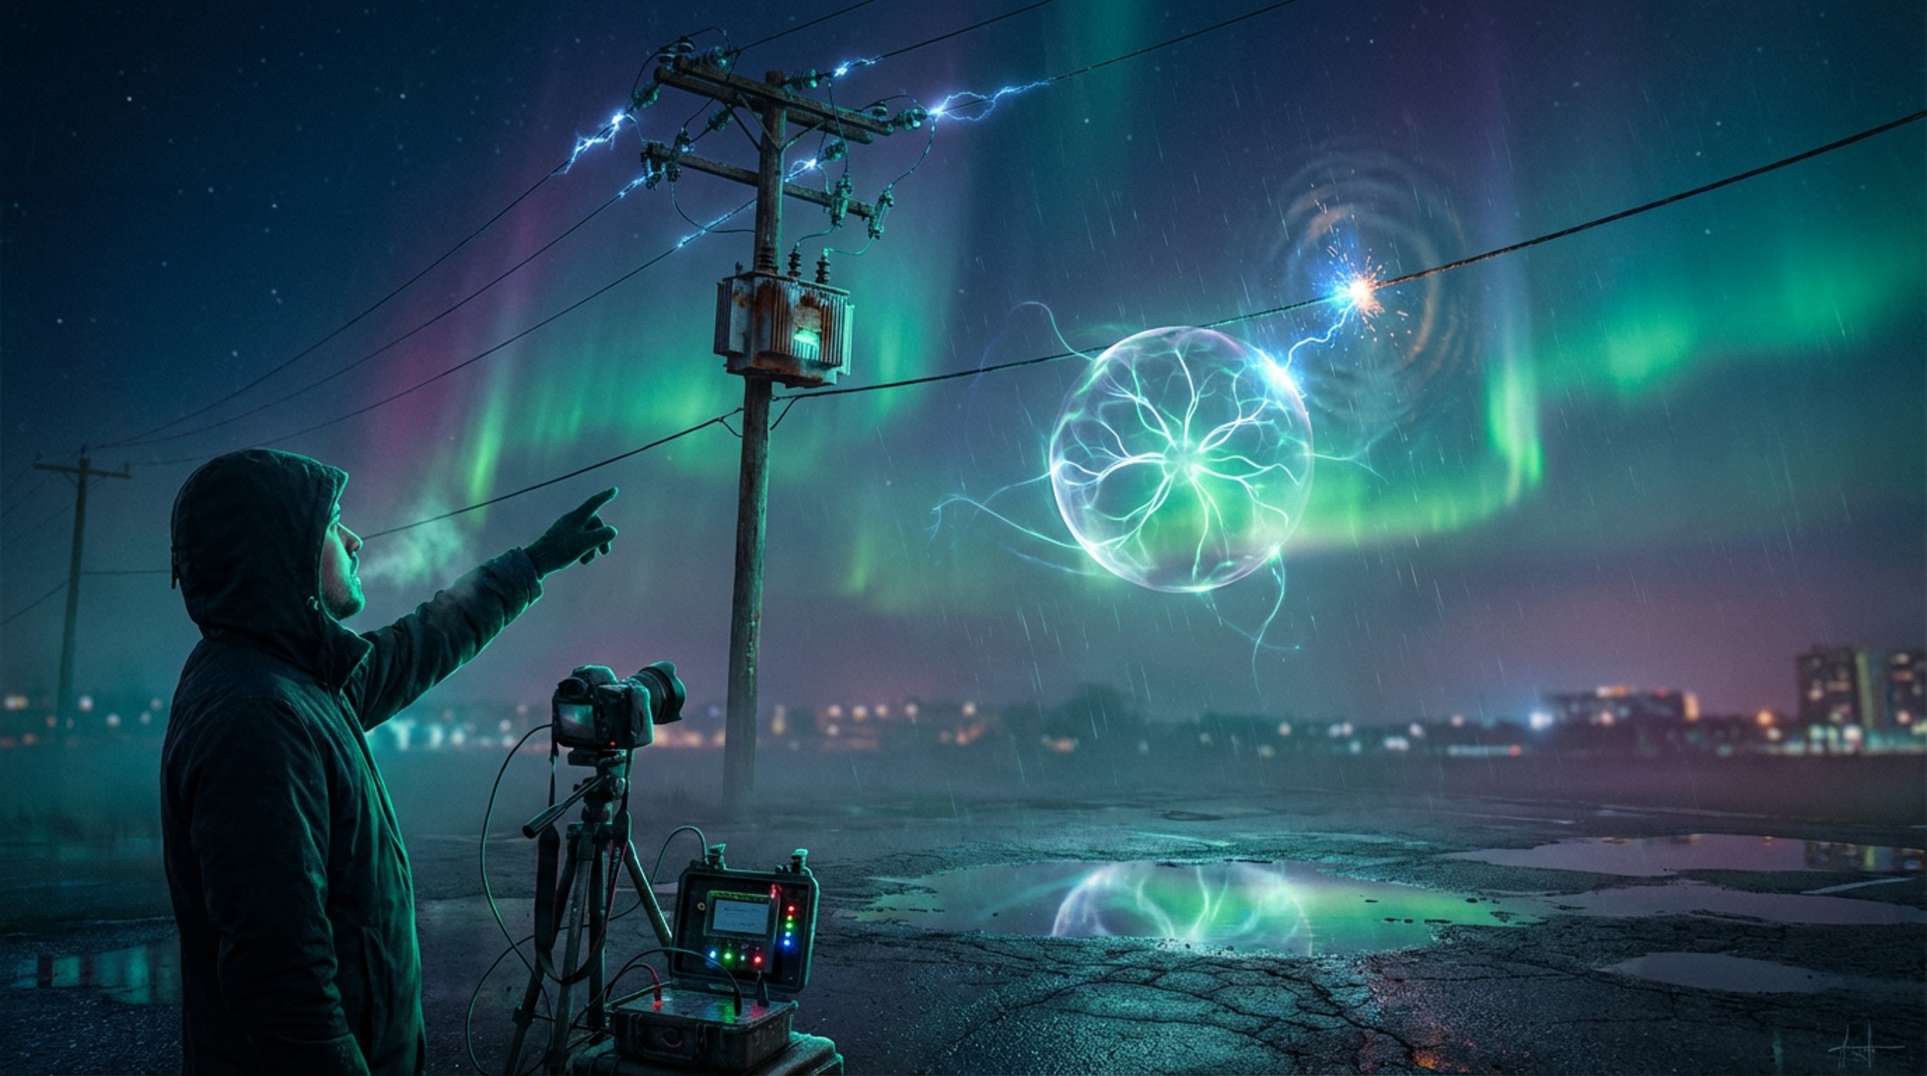
    Picture this: the sky shimmers with faint auroral glow, a distant transformer hums under strain. A witness freezes, pointing upward. There, a slow-moving luminous orb drifts against the stars, silent and steady. It hovers, then darts with abrupt speed, brushing near power lines before vanishing with a faint pop. These moments hit home for those on the ground—disrupting the ordinary, sparking questions about what’s really unfolding in our atmosphere during these charged nights.

    Reports often cluster around auroral displays or heightened geomagnetic activity. Witnesses describe spherical lights near thunderstorms or clear skies lit by northern lights. Some orbs interact with infrastructure, causing flickers or small bangs upon disappearance. In community threads on NUFORC, MUFON, and Reddit, these patterns emerge, drawing us into the experience alongside those who saw it firsthand.

    What Witnesses and Analysts Report

    From backyards to remote fields, people share stories of glowing spheres that defy easy labels. Descriptions vary—some orbs pulse with color, others remain steady white or blue. They hover silently, then accelerate sharply or fade away. Many sightings tie to storms or auroras, with reports of orbs weaving near lightning or power grids.

    Databases like NUFORC and MUFON log hundreds of these plasmoid or orb entries, amplified in online spaces such as Reddit and Discord where clusters get dissected. Independent researchers correlate them with geomagnetic spikes, like high Kp indices, or solar events. Ideas float around: ball lightning, atmospheric sprites, or plasma formations. Eyewitness accounts carry weight here—we value them as starting points, even as we recognize how phones, media buzz, and shared stories can shape what gets reported.

    Timelines, Tracks, and Hard Data

    Official records anchor the surge in solar activity. NASA and NOAA declared Solar Cycle 25’s maximum on October 15, 2024, with a 13-month smoothed sunspot number of 156.7 reported in August 2024. May 2024 stood out with a run of G4 to G5 geomagnetic storms, triggered by coronal mass ejections and detailed in AGU’s peer-reviewed work.

    Geomagnetic alerts rely on the Planetary K-index (Kp), scaling from 0 to 9, where Kp=9 signals a G5 extreme event, per NOAA’s Space Weather Prediction Center. Superbolt studies, like Ripoll et al. in Nature Communications (2021), show these lightning events emit 10 to 1000 times more VLF power into space than standard strikes, based on 2010-2018 catalogs.

    Ball lightning research draws from thousands of historical reports, with lab models exploring plasma and vortex theories, though no consensus on natural mechanisms exists, as noted in a 2019 Nature review.

    Key Data Points (Sources Linked in Context)
    Date/Metric Details Source
    Oct 15, 2024 Solar Cycle 25 Maximum Announcement NASA/NOAA
    May 2024 G4-G5 Geomagnetic Storms AGU/Wiley Analysis
    2010-2018 Superbolt VLF Factor (10-1000x) Ripoll et al., Nature Communications 2021
    Kp Index 0-9 Scale; Kp=9 = G5 Extreme NOAA SWPC

    Official Story vs. What the Data Suggests

    Agencies like NASA and NOAA stick to documented risks: solar maximum boosts flares and CMEs, leading to space-weather effects on satellites, radio, and power systems. They issue guidance but steer clear of linking this to ball lightning or unidentified aerial phenomena.

    Peer-reviewed papers back the storm intensity—May 2024’s events show clear magnetospheric impacts—and superbolt research highlights strong energy transfers upward. Yet, these don’t confirm ground-level plasmoids.

    Community voices push further, noting sighting clusters during high geomagnetic activity and suggesting ionospheric changes or induced currents as culprits. Independent analysts scale up lab plasma ideas, though open-air replication lags. Reporting bias plays a role too—more phones and online sharing during solar hype could swell numbers without true increases. Agencies focus on infrastructure threats, leaving plasmoid questions in the gray area of unproven possibilities.

    What It All Might Mean

    Solar Cycle 25’s peak in October 2024 ramps up flares and CMEs, driving geomagnetic disturbances that hit infrastructure hard— that’s the solid chain from official data.

    Connections to plasmoids and superbolts intrigue but lack proof. Superbolts pump massive VLF energy skyward, as in Ripoll’s 2021 study, and 2024’s storms altered EM fields, potentially stirring near-ground effects. Still, instrumented links to visible orbs are rare.

    Questions persist: Is the report spike real or biased? Can lab plasmoids explain wild ones? Do superbolts spawn ground phenomena? How much does media inflate counts? And why the gap in field sensors?

    For those tracking this, capture time-stamped video with GPS, note local Kp/Dst, and log weather. Consider building multi-sensor kits—optical cameras, EM detectors, magnetometers, audio for infrasound, all synced. This could shift us from stories to hard evidence.

    Frequently Asked Questions

    Reports have spiked from 2023 to 2025, often tied to Solar Cycle 25’s maximum phase announced in October 2024, which increases solar flares and geomagnetic storms. Community sources like NUFORC and MUFON note clusters during high Kp activity, but questions remain on whether this is causation or just more reporting due to media attention and smartphones.

    NASA and NOAA attribute solar maximum to higher chances of flares, CMEs, and space-weather impacts on tech like satellites and power grids. They don’t link it directly to ground-level orbs or plasmoids, focusing instead on verifiable geomagnetic disturbances like the May 2024 G4-G5 storms.

    Superbolt studies show 10-1000 times stronger VLF emissions, potentially altering atmospheric EM fields, as per Ripoll et al. (2021). Ball lightning has historical eyewitness backing and lab models, but no confirmed natural mechanism ties it definitively to solar activity or geomagnetic storms.

    Record sightings with time-stamped video, exact GPS locations, local Kp/Dst indices, and weather details. Building multi-sensor setups—like cameras, EM detectors, magnetometers, and audio recorders—could help gather data to bridge the gap between anecdotes and instrumented proof.

  • UFO Disclosure Data: What NASA and AARO Won’t Say

    UFO Disclosure Data: What NASA and AARO Won’t Say

    Key Takeaways

    • James Fox and CAMP guests claim a buildup of credible, multi-sensor and eyewitness evidence for anomalous aerial phenomena, long obscured by authorities, with disclosure on the horizon.
    • Public data from U.S. intelligence supports this with the ODNI’s June 2021 report on 144 mostly unexplained incidents over 17 years, and DoD/AARO’s count of 510 UAP reports as of August 30, 2022.
    • Unresolved tensions persist, as NASA‘s 2023 UAP study found no extraterrestrial evidence but highlighted data limitations, while questions linger over classified records, data quality, and cases like Varginha in January 1996, investigated in IPM n.18/1997.

    Nightfall at CAMP: A Filmmaker’s Confession by the Fire

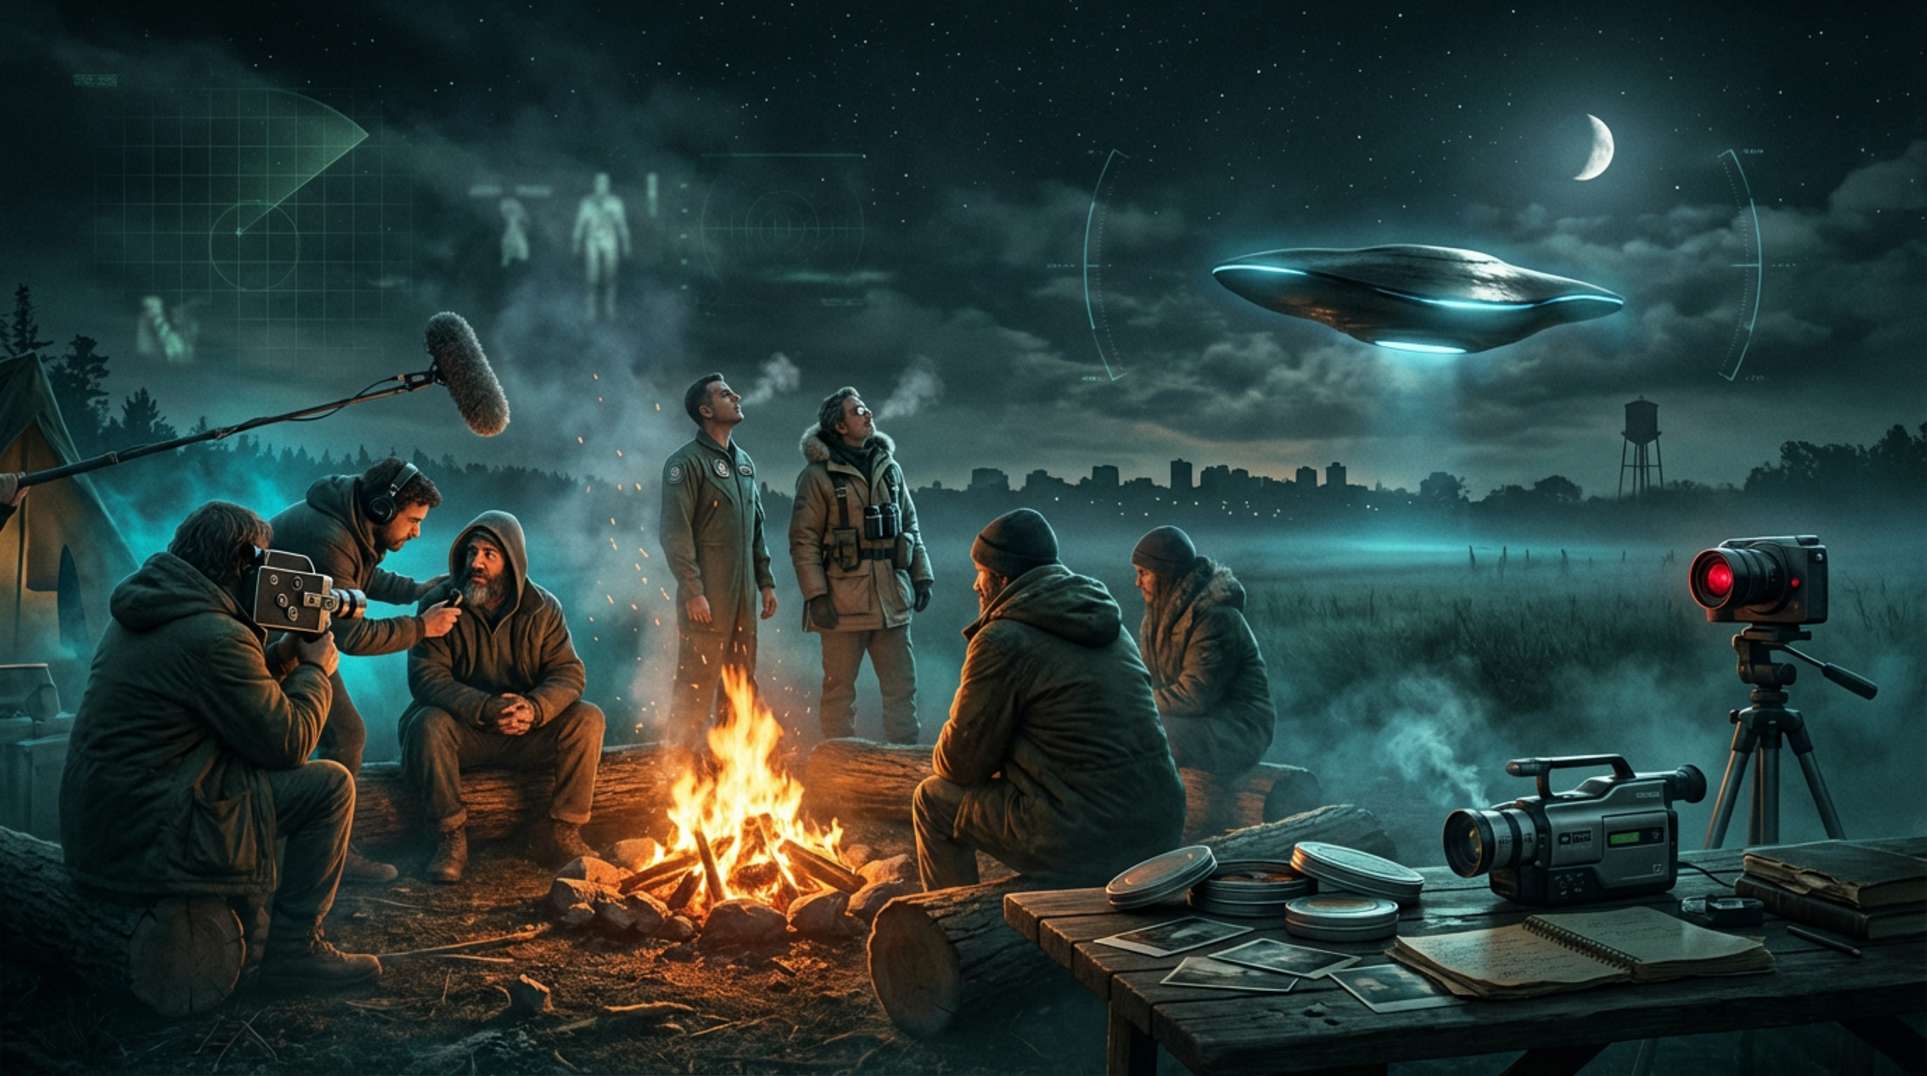
    The fire crackles under a starlit sky, casting flickering shadows on a tight circle of listeners at CAMP. James Fox, the filmmaker behind The Moment of Contact, arrives with a portable camera humming softly, ready to capture the moment. He leans in, sharing filmed anecdotes and documents that have stirred debates for years. The air feels charged—not with preaching, but with the weight of unspoken truths emerging. Here, amid the quiet wilderness, Fox opens up about patterns in the skies that challenge everything from national security to aviation safety. It sets the stage for two paths: today’s sensor-tracked anomalies and echoes from the past, like the Varginha encounter that still haunts Brazil.

    What Witnesses and Analysts Report

    Pilots and sensor operators describe events backed by radar, infrared, and visual confirmations—objects performing maneuvers that defy known physics. Experiencers speak of close encounters, sudden accelerations, and hints of recoveries shrouded in secrecy. In Varginha, Brazil, around January 20, 1996, three local women claimed to see a strange creature near a vacant lot. Soon after, reports surfaced of UFO sightings and military activity involving firefighters. Brazilian ufologists picked up the thread in 1996 and 1997, turning it into a cultural landmark with tourism, monuments, books, and films. Yet some witnesses later changed their stories or backed away, and many never spoke publicly. Stigma has always pushed these accounts underground, making a full picture hard to assemble.

    Timelines, Tracks, and Hard Data

    Official documents provide the backbone. The ODNI’s Preliminary Assessment from June 2021 examined 144 incidents over 17 years, concluding most remain unexplained and calling for better reporting. The DoD’s AARO, evolving from the UAPTF, documented 510 UAP reports in its dataset by August 30, 2022. NASA’s UAP study, announced on June 9, 2022, and finalized on September 14, 2023, urged standardized data collection while finding no extraterrestrial links. For Varginha, the Brazilian military’s IPM n.18/1997 inquiry, archived as Autos Findos n.908/1997, dismissed allegations as misidentifications without criminal elements. The story exploded in media from 1996 to 1997, shaping local culture ever since.

    Event/Report Date/Key Metric
    ODNI Preliminary Assessment June 2021: 144 incidents over 17 years
    AARO UAP Reports 510 reports as of 30 Aug 2022
    NASA UAP Study Announced 9 Jun 2022
    NASA Final Report 14 Sep 2023
    Varginha Event ~20 Jan 1996
    IPM Inquiry n.18/1997

    For deeper dives, check primary sources like the ODNI report, AARO historical documents, NASA’s final report, and scanned IPM summaries—links in the sourcing box below.

    Official Story vs. What the Data Suggests

    Agencies like ODNI, DoD, and NASA acknowledge unexplained events as real concerns for safety and security, but they point to data gaps and push for better tools. ODNI noted incursions without clear answers; AARO cataloged hundreds of reports; NASA called for scientific standards, seeing no ET proof. On Varginha, the military’s IPM n.18/1997 found no extraterrestrial evidence, suggesting everyday mix-ups instead. But researchers counter with patterns of multi-sensor hits across cases, and some journalists highlight unaddressed witness accounts or leaked files. Ufologists argue the inquiries missed key testimonies. What about classified annexes that could shift the story? Or the scarcity of sharable, high-quality sensor data? Agencies recommended third-party access, yet raw files remain locked away. These gaps keep the debate alive.

    What It All Might Mean

    Credible sources now confirm unexplained phenomena pose real risks, with new frameworks like AARO and NASA’s study stepping up the response. Still, classified details, the count of top-tier cases, and puzzles like Varginha’s alleged captures hang in the balance. This touches national security, safe skies, scientific progress, and places like Varginha, where the event reshaped lives and local economies. To move forward, chase FOIA requests for hidden annexes, push for de-identified sensor data, talk to surviving witnesses, and cross-check IPM records. Frame it as testing hypotheses—artifacts, known tech, or something truly anomalous—without rushing to labels. The record calls for better data and open access. Until that happens, mystery and fair doubt walk hand in hand.

    Frequently Asked Questions

    James Fox highlights credible multi-sensor and eyewitness accounts of anomalous aerial phenomena, backed by official reports like the ODNI’s 144 unexplained incidents and AARO’s 510 UAP reports. He argues authorities have obscured these, but disclosure feels imminent based on mounting data.

    Witnesses in Varginha, Brazil, reported seeing a strange creature and UFO activity in January 1996, with military involvement noted. Official inquiries like IPM n.18/1997 dismissed extraterrestrial claims, suggesting misidentifications, but ufologists point to unresolved testimonies and cultural impacts like local tourism.

    NASA’s study found no evidence of extraterrestrial origins in the incidents reviewed but stressed that limited, non-standardized data hinders conclusions. It recommended improved measurement programs and data standards to better analyze these phenomena.

    Agencies cite data gaps and emphasize security concerns, often proposing mundane explanations. Witnesses and researchers highlight patterns in multi-sensor data and unaddressed testimonies, questioning if classified information or incomplete inquiries leave gaps in the official narrative.

    These incidents raise issues of aviation safety, national security, and scientific standards. They also affect communities like Varginha, where events have influenced local culture and economy, underscoring the need for better data access and investigation.

  • Interstellar Maelstrom: What Really Hit Earth in 2025

    Interstellar Maelstrom: What Really Hit Earth in 2025

    Key Takeaways

    • 3I/ATLAS (C/2025 N1) was discovered on 1 July 2025 and made its closest approach to Earth on 19 December 2025 at roughly 1.798 AU, or about 269 million km. Agencies like NASA, ESA, and JPL tracked it closely and confirmed no impact threat.
    • Earth passes through the Sun’s neutral interstellar helium focusing cone each early December. This is a detectable but extremely thin flow of atoms, documented by missions like SOHO and STEREO, posing no direct hazard to life or weather.
    • Multiple planets formed striking conjunctions and a ‘planet parade’ from December 2025 into January 2026. Visually impressive, but gravitational effects on Earth remain negligible.
    • What lingers: Could these three separate factors create any combined heliospheric or geophysical signal? This stays open, calling for checks on data like Kp/Dst indices, neutron monitors, ACE/DSCOVR readings, and TEC maps.

    A Night the Sky Felt Crowded

    The end of 2025 brought skies alive with activity. Watchers gathered under clear nights, binoculars in hand, tracking the comet 3I/ATLAS as it emerged from solar conjunction. Planets lined up in a rare parade, visible to the naked eye and through simple scopes, as guides from NASA Skywatching and EarthSky highlighted the show.

    After its perihelion in late October and a period hidden by the Sun, the comet reappeared in November and December. Professionals pointed Hubble, JWST, and ExoMars at it, while amateurs with Unistellar setups and backyard rigs captured their own views.

    Social channels buzzed. Fresh images from institutions mixed with crowdsourced shots, building a shared excitement. Even routine events felt charged in this collective watch.

    What Witnesses and Analysts Report

    In online forums and independent channels, the overlap drew sharp attention. Commentators and researchers dubbed it the ‘Interstellar Maelstrom,’ suggesting possible energetic shifts from the comet’s path, the helium cone transit, and the planetary alignments. YouTube videos and public posts framed it as a moment of transformation.

    Witnesses shared accounts of heightened electromagnetic sensations, odd aurora sightings, and instrument glitches. Some pointed to 3I/ATLAS showing non-gravitational acceleration or magnetic quirks, turning these into testable ideas discussed across platforms.

    Coordinated efforts through IAWN, plus Unistellar and backyard observers, fed data and speculation alike. Institutional shots from JWST and HST only fueled the talk.

    Geophysicist Stefan Burns led the charge, hosting a Q&A where he posed questions about linked effects. He urged the community to dig into data, treating these claims as serious leads worth pursuing.

    Timelines, Tracks, and Hard Data

    Let’s anchor this in facts. 3I/ATLAS was spotted on 1 July 2025, hit perihelion around 30 October at about 1.4 AU, and skimmed closest to Earth on 19 December at 1.798 AU—roughly 269 million km. Sources like NASA, ESA, TheSkyLive, and JPL back this up.

    The helium focusing cone? Earth crosses it every early December, a subtle stream observed by SOHO and STEREO. It’s thin, far less dense than our atmosphere or magnetosphere, per peer-reviewed papers on pickup ions.

    The planet parade stretched from late 2024 into 2025, with groupings peaking in December and January 2026, as noted in NASA Skywatching, EarthSky, and StarWalk calendars.

    Tracking came from HST, JWST, ExoMars, Mars Express, and amateur networks. Ephemerides are public via ESA, NASA, and JPL Horizons.

    To compare scales, here’s a quick reference:

    Event Dates Closest Distance to Earth Key Observers Primary Source
    3I/ATLAS Comet Discovery: 1 July 2025; Perihelion: ~30 Oct 2025; Earth Approach: 19 Dec 2025 1.798 AU (~269M km) HST, JWST, ExoMars, Unistellar, Backyard Observers NASA/ESA/JPL
    Helium Focusing Cone Early December Annually N/A (Heliospheric Phenomenon) SOHO, STEREO SOHO/STEREO Literature
    Planetary Parade Dec 2025–Jan 2026 N/A (Visual Alignments) Naked Eye, Binoculars, NASA Skywatching EarthSky, StarWalk

    For combined effects, look at geomagnetic indices like Kp and Dst, neutron monitor counts for cosmic rays, solar wind data from ACE, DSCOVR, and Wind, ionospheric TEC maps, and JPL Horizons for astrometry and non-gravitational fits.

    Official Story vs. What the Data Suggests

    Agencies like NASA, ESA, and JPL describe 3I/ATLAS as a tracked interstellar visitor, no threat in sight. The helium cone is a known, faint feature, and planetary lineups are just visual— no physical pull on Earth, per their fact pages and SOHO/STEREO docs.

    Yet community voices see potential in the timing: maybe amplified heliospheric effects or magnetic oddities in the comet. These ideas need astrometric checks and peer review to hold up.

    To test, pull JPL Horizons orbital solutions and uncertainties for 3I. Scan geomagnetic indices and neutron monitors from December 2025 to January 2026. Match ionospheric TEC and magnetometer logs to amateur observation times. Check spacecraft reports for pickup-ion spikes during the cone transit.

    Current data shows small, familiar effects individually. No big signal yet, but that limits scale, not possibility.

    What It All Might Mean

    The core evidence stands: documented dates for 3I/ATLAS, the helium cone’s annual timing, and the planet parade’s visibility, all confirmed by NASA, ESA, SOHO, STEREO, IAWN, and amateur sources.

    Open questions persist. Did the overlap spark any measurable response in the magnetosphere, cosmic rays, or ionosphere? Do comet ‘anomalies’ demand new models, or fit within outgassing norms? JPL Horizons and peer analysis will tell.

    For follow-up: Gather JPL ephemeris and non-gravitational fits. Pull time series for Kp/Dst, neutron monitors, ACE/DSCOVR, TEC, and ground magnetometers from December 2025–January 2026. Align eyewitness reports with logs.

    This matters beyond physics—it’s cultural. Real events can spark powerful stories. Solid data checks build trust, separating real patterns from hype.

    As for Stefan Burns’ Q&A: He framed the ‘Interstellar Maelstrom’ as a convergence worth watching for energetic links. Possible mechanisms? Subtle heliospheric interactions, if any. He recommends datasets like geomagnetic indices and plasma readings. Key questions: Any spike in cosmic ray fluxes? Do comet trajectories show unexplained deviations? How do ionospheric changes align with the timelines?

    Frequently Asked Questions

    In December 2025, comet 3I/ATLAS made its closest Earth approach, Earth transited the helium focusing cone, and planets aligned in a visible parade. These were tracked by agencies and amateurs, creating a buzz in online communities.

    Community reports include electromagnetic sensations and instrument anomalies, but official data shows individual events as benign. Combined effects remain unproven, needing checks on geomagnetic and plasma data.

    NASA, ESA, and JPL maintained that the comet posed no threat, the helium cone is tenuous, and alignments are visual only. They emphasized tracking and fact pages to counter speculation.

    Access JPL Horizons for orbital data, review geomagnetic indices like Kp/Dst, and check neutron monitor and TEC maps for December 2025–January 2026. Cross-reference with eyewitness timings for patterns.

    Some claim non-gravitational acceleration or magnetic effects, but these need astrometric analysis. Current models attribute comet behavior to outgassing, though data checks could reveal more.

  • Apex Critical Metals Confirms Significant Magnetic Anomaly at Cap Project, British Columbia

    Apex Critical Metals Confirms Significant Magnetic Anomaly at Cap Project, British Columbia

    Key Takeaways

    • Apex Critical Metals has confirmed a large-scale magnetic anomaly at their Cap Project in British Columbia via high-resolution airborne surveys, hinting at untapped niobium and rare earth deposits below the surface.
    • This anomaly aligns with patterns of geophysical “glitches” that often point to hidden structures or overlooked systems, raising questions about what prior explorations might have missed—or ignored.
    • Actionable steps for vigilance include monitoring local activity, requesting public data, and cross-verifying with global magnetic grids to build a community-driven record of the site’s developments.

    Uncovering the Signal in British Columbia’s Backcountry

    Out in the remote stretches of British Columbia, where the terrain hides more than it reveals, Apex Critical Metals just dropped a report that’s got my attention. They’ve confirmed a significant magnetic anomaly at their Cap Project through a fresh airborne geophysical survey. We’re talking a high-resolution scan that picked up a strong, elongated feature—stretching over 1.2 kilometers and dipping eastward. This isn’t some faint whisper; it’s a bold signal suggesting deep subsurface structures loaded with niobium and rare earth elements. The kind of find that could reshape mining prospects, but also the sort that makes you wonder what’s really buried there.

    I’ve been tracking these magnetic disruptions for years. They show up as irregularities in the Earth’s field, often marking mineral deposits, old volcanic remnants, or sometimes things that don’t fit the official story. In this case, the anomaly lines up with earlier drilling from decades ago—holes that hit mineralization but apparently missed the core of it. Apex’s team ran a helicopter-borne survey with tight 50-meter line spacing, using advanced magnetics and radiometrics to map it out. The data points to a source deeper than those old probes reached, possibly a sizable plug or intrusive body. But here’s where it gets interesting for us: anomalies like this have a habit of concealing more than rocks. Think unexploded ordnance from forgotten tests, subsurface installations tucked away from prying eyes, or even natural formations that echo reports of anomalous energy zones.

    Patterns That Echo Across the Map

    Zoom out, and this fits a broader mosaic. Magnetic anomalies are the Earth’s way of leaking secrets—glitches in the grid that explorers chase, but governments sometimes classify. Remember how similar surveys have uncovered hidden bunkers or ancient crash sites in remote areas? The Cap Project sits in a region with its own history of mineral rushes and quiet explorations. Apex is positioning this as a critical metals play—niobium for high-strength alloys, rare earths for tech we can’t build without. But the unexplained angle? That precise, measurable disruption could indicate something larger at play. Was the original drilling halted for reasons beyond geology? Does this anomaly connect to regional magnetic trends that hint at tectonic oddities or man-made interventions? We’re not jumping to conclusions, but these are the threads worth pulling.

    I’ve cross-referenced this with public datasets like EMAG2 from NOAA. The Cap area’s signal stands out, but it’s not isolated. Similar elongated features pop up in places tied to black-budget whispers or unexplained aerial sightings. If this is just minerals, fine—but the potential for cover-up lies in how quickly it gets developed or buried under permits. That’s why vigilance matters here.

    Steps to Stay Ahead of the Curve

    If you’re in the area or tracking from afar, don’t just watch—act. For locals and environmental groups, keep an eye on permit filings through BC’s online registries. Note any uptick in airborne surveys, road work, or water diversions, and document it with photos and reports to authorities or conservation outfits. Citizen investigators, request the raw survey data from Apex or provincial regulators—archive those flight-line maps and grids. Compare them against USGS or NOAA magnetic data for discrepancies, and back everything up with timestamps.

    On the investment side, if critical metals are your game, dig into Apex’s filings and NI 43-101 reports. Junior miners can swing wild—watch for hype cycles, secure your accounts with multi-factor auth, and verify every prospectus. Technically minded folks, push for ground-truthing like gravity or IP surveys. Reach out to nearby universities or geophysicists to replicate the findings independently. These moves turn passive interest into a network of eyes on the ground, building evidence that can’t be easily dismissed.

    Frequently Asked Questions

    It’s a sharp, elongated feature over 1.2 km, detected with high-res airborne tech, pointing to deep niobium and rare earth sources that earlier drills skimmed past. These kinds of signals often flag hidden systems, not just ore—worth watching for what they might conceal.

    Possibly—magnetic disruptions like this echo patterns in areas with aerial anomalies or subsurface oddities. It’s not direct proof, but the overlap with black-budget zones or energy hotspots makes it a thread to follow, especially if development gets unusually quiet.

    Request it from Apex Critical Metals, BC provincial regulators, or the Mines online registry. Cross-check with public grids like EMAG2 from NOAA, and archive everything—flight paths, magnetometer readings—to spot any inconsistencies over time.

    Junior miners can pump stocks on hype, so review filings, NI 43-101 plans, and watch for dump patterns. Secure your accounts and verify sources—these anomalies can draw fast money, but also scrutiny if something bigger lurks beneath.

  • Interstellar Comet 3I/ATLAS: Cryovolcano or Hype?

    Interstellar Comet 3I/ATLAS: Cryovolcano or Hype?

    Key Takeaways

    • 3I/ATLAS is an interstellar (hyperbolic) comet discovered by the ATLAS survey and reported to the Minor Planet Center on 1 July 2025 (NASA).
    • Multiple teams observed sudden jetting, rapid brightening, and spectral features; some authors describe these as consistent with cryovolcanic-style eruptions or rapid surface activation as the object warmed.
    • OSIRIS-REx samples from Bennu (returned Sept 24, 2023; lab papers 2024–2025) show abundant organics, phyllosilicates, magnetite and prebiotic precursors — relevant analogues but not evidence of life.
    • Unresolved: whether 3I/ATLAS’s activity represents true internal cryovolcanism, a surface sublimation process, or a hybrid; and whether small bodies like this could host environments or magnetic processes sufficient for prebiotic chemistry or life.

    A Quiet Wake-Up Call in Deep Space

    Picture it: a frozen wanderer from beyond our solar system, hurtling through the void for eons, silent and dark. Then, as it sweeps into the inner reaches, closing in on the Sun, something shifts. Perihelion hits around 29–30 October 2025, at about 203 million km from that blazing star. Solar conjunction blocks much of our Earth-based view during the closest pass, leaving gaps in the optical record.

    Before that, it grazed near Mars on ~3 October 2025, just 0.194 AU away, clocking speeds up to 137,000 mph at discovery and accelerating as it dove inward. Hubble and other space assets caught glimpses—images from Psyche and mission updates show the approach in stark detail. The cold intruder, indifferent to our gaze, suddenly flares. Jets erupt. Brightness spikes. What was dormant now roars to life, a dramatic turn that raises questions we can’t ignore.

    What Witnesses and Independent Analysts Reported

    Across online forums and video channels, reports poured in from those tracking the skies. Independent researchers like Stefan Burns highlighted a surge in activity once 3I/ATLAS hit ~2.5 AU, calling it a global cryovolcanic event. In one video, Burns points to timing and spectral shifts: “This isn’t just ice turning to gas; we’re seeing eruptions that could generate organics or even local magnetic fields—prime for seeding life.”

    Amateur astronomers echoed this in places like r/HighStrangeness, sharing images of jets and debating the Interstellar Seed Hypothesis. One forum post noted, “The rapid brightening screams cryovolcanism, not plain sublimation—think metal-rich reactions driving exotic outgassing.” Meanwhile, r/space and r/astronomy users urged caution, sticking to primary data: “Jets are clear in the spectra, but let’s not jump to panspermia without isotopic proof.”

    Content creators amplified these ideas, framing the comet as a potential carrier of prebiotic materials. They cite CO detections and water signals as hints of deeper processes, pushing narratives of intentional seeding without claiming proof. These voices build their cases on shared observations, respecting the data while exploring bold edges.

    Timelines, Tracks, and Hard Data

    The facts anchor everything. Discovery came on 1 July 2025, reported to the Minor Planet Center via NASA’s ATLAS survey. Perihelion followed on ~29–30 October 2025 at ≈203 million km from the Sun, with Earth conjunction cutting optical monitoring. Closest Earth approach is forecasted for ~19 December 2025 at ≈1.8 AU. The Mars flyby happened ~3 October 2025 at 0.194 AU.

    Nucleus size estimates range from ≳440 m to ≤5.6 km, based on observational limits from NASA teams. Velocity at discovery: ~137,000 mph (~221,000 km/h), on a hyperbolic orbit confirming its interstellar roots. Spectra show carbonaceous and metal-bearing signatures, with CO and water detections; preprint papers invoke cryovolcanism as a model.

    For context, OSIRIS-REx returned Bennu samples on 24 Sept 2023, with 2024–2025 analyses revealing organics, phyllosilicates, magnetite, sugars, and prebiotic precursors—no life, but clear building blocks (NASA, NTRS, Smithsonian).

    Metric Details
    Discovery Date 1 July 2025 (Minor Planet Center)
    Perihelion ~29–30 October 2025, ≈203 million km from Sun
    Closest Earth Approach ≈1.8 AU, ~19 December 2025
    Mars Flyby ≈0.194 AU, ~3 October 2025
    Size Range ≳440 m to ≤5.6 km
    Velocity at Discovery ~137,000 mph (~221,000 km/h)
    Spectral Detections Carbonaceous/metal-bearing, CO, water
    OSIRIS-REx Highlights Organics, phyllosilicates, magnetite, prebiotic precursors

    Official Story vs. What the Data Suggests

    NASA labels 3I/ATLAS interstellar, coordinates observations, and insists it poses no Earth threat. Agency statements stress data collection: “We’re gathering spectra and images carefully—activity is notable, but interpretations need rigor” (NASA science page).

    A spectrophotometric preprint echoes this, reporting primitive carbonaceous reflectance and proposing cryovolcanism as an analogy: “Jets align with volatile eruptions, but we can’t confirm internal sources without more data” (Astrobiology coverage).

    Independents push further. Stefan Burns and forum analysts see global cryovolcanism, linking it to magnetic fields and seeding: “This could be a life factory” (video paraphrase). Direct observations back jets and brightening, but mechanisms split: sublimation (official lean) vs. internal eruptions (community view). Bennu overlaps in composition, yet interstellar origins differ—no shared history assumed. Peer caution contrasts community boldness; evidence supports activity, not speculative leaps.

    How Far Can the Evidence Carry the Seed Hypothesis?

    Could a body this small—sub-km to a few km—hold internal reservoirs for true cryovolcanism? Physics scaling suggests doubts; pressure might not build enough without larger mass. Magnetic fields? Possible if metal reactions churn, but measurements are absent.

    Chemically, Bennu’s organics and precursors offer parallels, yet thermal histories diverge. Prebiotic chemistry needs sustained conditions—jets might create fleeting microenvironments, but evidence is thin. Imagine ejected fragments with complex isotopes; that could hint at seeding.

    To test: in situ magnetometry, coma analysis for organics, fragment detection. Solar conjunction hid perihelion details, though spacecraft like Psyche grabbed data. Planetary scientists note: “Small bodies activate, but magnetism and habitability stretch feasibility” (geophysicist quote). Speculative, yes—but gaps invite scrutiny.

    What It All Might Mean

    Strongest points: hyperbolic orbit proves interstellar travel, jets and spectra confirm activation with carbonaceous metals, Bennu samples show small bodies carry organic complexity and altered minerals.

    unknowns loom. Is it sublimation or cryovolcanism? Can these objects spark magnetic fields or viable niches? Similarities to Bennu—shared processes or fluke?

    Track arXiv updates, mission datasets, push for magnetometry in future probes. Here’s an invite: dig into the sources, test the ideas. The patterns tease panspermia possibilities, demanding bold questions and sharp evidence.

    Frequently Asked Questions

    3I/ATLAS, an interstellar comet, was discovered on 1 July 2025 and showed sudden jetting and brightening as it approached the Sun, with perihelion around 29–30 October 2025. Observations suggest cryovolcanic-style activity, but the exact mechanism remains unclear.

    Spectral data show carbonaceous materials and organics similar to Bennu samples, which contain prebiotic precursors but no life. Independent analysts propose seeding hypotheses, but these are speculative without direct proof like complex isotopes or magnetic fields.

    NASA classified it as interstellar, coordinated observations, and stated it poses no threat to Earth. They emphasize careful data analysis and caution against overinterpretation, contrasting with community views on cryovolcanism and seeding.

    Key gaps include whether the activity is true cryovolcanism or surface sublimation, if small bodies can generate magnetic fields, and how compositional similarities to Bennu inform interstellar chemistry. Solar conjunction limited perihelion data.

    Check arXiv preprints, NASA mission updates, and forums like r/space for new data. Advocate for future missions with magnetometry and coma analysis to test hypotheses.

  • Video Captures Flash of Light Before Loud Boom in Webster, N.Y. — New Doorbell Footage Deepens Mystery of Unexplained Sky Explosions

    Video Captures Flash of Light Before Loud Boom in Webster, N.Y. — New Doorbell Footage Deepens Mystery of Unexplained Sky Explosions

    Key Takeaways

    • Doorbell footage from Webster, N.Y., captures a bright flash followed by a massive boom, adding visual evidence to a string of unexplained sky explosions in the area.
    • This incident fits into a larger pattern of sky trumpets and skyquakes reported worldwide, where ordinary explanations fall short and hidden causes—like military tests or atmospheric anomalies—start to surface.
    • Readers should document similar events with timestamps, back up footage, and coordinate with neighbors to build a stronger picture of these anomalies.

    The Flash and Boom in Webster

    It’s one of those nights in Webster, New York, where the ordinary gives way to something that lingers in the back of your mind. A doorbell camera on Lake Road picks up a sudden flash in the sky, bright and fleeting, right before a thunderous boom shakes the neighborhood. This isn’t just a sound—it’s a sequence: light, then impact. Reported around Bay Road, the event joins a series of similar booms that have rattled the town over recent weeks. No storms on the radar, no fireworks scheduled. Just that flash, that noise, and questions stacking up like unread files in a dim-lit office.

    Connecting the Dots to Sky Trumpets

    We’ve heard these before—those eerie trumpet-like sounds echoing from empty skies, or the ground-shaking booms with no clear source. Sky trumpets, skyquakes, whatever you call them, they’ve been reported from rural spots to urban edges, often in clusters. Webster’s case stands out because of the footage: that flash ties the visual to the auditory, making it harder to dismiss as distant thunder or a quarry blast. Look back at reports from places like the Midwest or even overseas—similar patterns emerge. A flash here, a boom there, and suddenly you’re wondering about meteors breaking up in the atmosphere, or maybe something more deliberate, like black-budget flight tests pushing the envelope. The repetition in Webster suggests not randomness, but a rhythm, a hidden cadence we’re only starting to trace.

    What Could Be Behind It?

    Mainstream outlets might lean on the usual suspects: sonic booms from aircraft, industrial echoes, or even frost quakes if the weather fits. But with that flash preceding the sound, those explanations strain. Meteoric entries can produce both light and shockwaves, yet no debris was reported. Military activity? The area’s not far from bases where experimental tech could be in play, unregistered and off the books. Or consider atmospheric phenomena—plasma discharges or something geophysical we haven’t fully mapped. These aren’t wild guesses; they’re threads pulled from similar incidents logged over years. The key is the pattern: isolated events become a network when you step back and connect them.

    Steps to Stay Ahead

    If you’re tracking this, don’t just listen—act. Set up your cameras to record with timestamps, and back up any footage off-site right away. Note the exact time, location, and any device glitches, like EM interference on your phone or radio. Share with local authorities, but also feed it into open-source trackers where patterns can build collectively. Get your neighbors involved—establish a simple group chat for real-time reports. If it points to something falling from the sky, steer clear of potential impact zones. And keep basics on hand: water, lights, a radio that doesn’t rely on grids. This isn’t about panic; it’s about preparedness, turning anomalies into data we can use.

    Frequently Asked Questions

    The doorbell footage shows a clear flash of light just before the boom, linking visual and sonic elements in a way that challenges everyday explanations like thunder or industrial noise.

    Patterns overlap with some aerial anomaly reports, but without hard links, we’re looking at atmospheric or covert tech causes first—though the dots are there if you trace them.

    Record with timestamps on cameras or phones, note geolocation and any device interference, back it up securely, and report to both officials and anomaly trackers for pattern-building.

    It’s a possibility—proximity to bases and the clustered nature fit black-budget ops, but we’d need more data points to confirm over natural causes like meteors.

    Stay alert but don’t approach potential sites; coordinate with neighbors, document everything, and have emergency supplies ready in case it’s part of a larger event.

  • Oysters are dying off in huge numbers in Japan. Nobody knows why

    Oysters are dying off in huge numbers in Japan. Nobody knows why

    Key Takeaways

    • Mass oyster die-offs are hitting Japan’s aquaculture hard, with no confirmed cause despite ongoing probes into pathogens and algal blooms.
    • This anomaly echoes broader patterns of unexplained environmental disruptions, potentially masking hidden contaminants or overlooked threats.
    • Audience actions include demanding data transparency, testing local seafood, and pushing for independent investigations to safeguard coastal communities.

    The Silent Die-Off in Japanese Waters

    Picture this: along the rugged coasts of Japan, where the sea meets ancient fishing traditions, something is going wrong. Oysters, those resilient filter-feeders that underpin a vital industry, are perishing in droves. Reports from Hiroshima and other key regions describe entire beds wiped out—shells empty, harvests decimated. It’s not a slow decline; it’s sudden, widespread mortality that’s left experts scrambling. And here’s the hook: nobody can pin down why. Official investigations point to possible pathogens or harmful algal blooms, but the tests keep coming up inconclusive. In the quiet hours, you start to wonder—what’s being overlooked in the water?

    Unpacking the Anomaly

    Japan’s oyster farms aren’t small operations; they’re a cornerstone of regional economies, supplying markets far and wide. The die-offs began ramping up recently, with farmers reporting losses in the tens of thousands. Water samples are being analyzed for bacteria, viruses, even chemical traces, but the results offer no smoking gun. Algal blooms, those toxic red tides that can choke marine life, are a prime suspect—yet monitoring stations haven’t flagged the usual warning signs. Pathogens? Sure, they’re testing for known culprits like vibrio or norovirus, but nothing matches the scale of the kills. This isn’t just bad luck; it’s a pattern that defies the standard environmental playbook.

    What makes this fit into our wheelhouse at The Unexplained Company? It’s that nagging void between the evidence and the explanation. We’ve seen it before in mass bird die-offs or bee colony collapses—sudden, unexplained losses that hint at forces operating just beyond the visible spectrum. Could it be industrial runoff slipping through the cracks? Military activities in nearby waters stirring up contaminants? Or something stranger, like an emergent pathogen that’s evaded detection? The official narrative is holding steady on natural causes, but the absence of answers opens doors to those deeper questions we chase in the shadows.

    Patterns in the Depths

    Step back, and you see this isn’t isolated. Global die-offs have dotted the map in recent years: fish washing up on shores from California to the Gulf, whales beaching in unusual numbers. Japan’s oysters join a quiet chorus of anomalies that challenge the idea of a stable ecosystem. We’re not talking wild speculation here—just connecting dots. If it’s not algae or infection, what about subsurface disturbances? Seismic activity, perhaps, or unseen chemical leaks from black-budget ops that never make the headlines. Our network of trackers knows these glitches often signal bigger shifts, whether environmental tipping points or something engineered in the dark.

    The economic ripple is real too. Fishermen are facing ruin, supply chains disrupted, and that’s before you factor in food security. In a world where anomalies like this can cascade, it’s worth noting how quickly they get filed under “natural phenomena” without full scrutiny. That’s where the cover-up angle creeps in—not overt conspiracy, but a systemic reluctance to probe too deep when industries or governments might be implicated.

    Vigilance and Next Steps

    So, what do we do with this? First, stay sharp on the mental front: don’t swallow preliminary reports whole. Demand those test results go public, with independent eyes reviewing them. On the data side, advocate for open-access monitoring—water quality logs, pathogen screens, the works. Archive what you can; mirror it across platforms to keep it from vanishing.

    For those near coasts, get practical: test your local catch before it hits the table, steer clear of flagged zones, and amp up biosecurity if you’re in the trade—quarantines, gear checks, the basics that could stem a spread. And don’t stop there; reach out to reps, push for swift investigations and support for the hit communities. These steps aren’t paranoia; they’re preparedness in a world full of blind spots.

    Frequently Asked Questions

    Officials are eyeing pathogens and algal blooms, but tests are inconclusive so far. It’s that gap in the data that makes this a classic unexplained glitch—could be hidden contaminants or something slipping under the radar.

    Think of it as part of a pattern: mass die-offs worldwide, from bees to whales, often without clear causes. These events hint at broader disruptions, possibly environmental or even obscured human factors we haven’t fully mapped.

    Test local seafood for safety, avoid affected zones, and boost biosecurity measures. Also, pressure local officials for transparent investigations—it’s about building resilience against these unseen threats.

    Not outright, but the slow drip of information raises flags. When explanations lag behind the facts, it often points to reluctance in probing industry or military ties—keep watching for those buried connections.

    Archive public data, share it widely, and contact representatives for independent reviews. It’s low-key action that ensures these anomalies don’t get swept under the tide without scrutiny.

  • When the Simulation Glitches: A Cascade of ‘Impossible’ Disasters and What It Means for Your Grid Survival

    When the Simulation Glitches: A Cascade of ‘Impossible’ Disasters and What It Means for Your Grid Survival

    Key Takeaways

    • A single day—November 28, 2025—saw an unprecedented cluster of natural disasters and sky anomalies, framed as a “simulation glitch,” highlighting vulnerabilities in our power grids and infrastructure.
    • These cascading events underscore the fragility of centralized systems, from weather extremes to geological shifts, urging a shift toward personal resilience in grid-down scenarios.
    • Actionable steps include building backup power, securing off-grid communications, and hardening data practices to maintain situational awareness amid disruptions.

    The Day the Code Cracked

    Picture this: you’re staring at the feeds, the ones that bypass the official channels, and there it is—a perfect storm of anomalies all hitting on the same date, November 28, 2025. Earthquakes rattling foundations in unexpected places, volcanic plumes choking the skies, freak storms tearing through grids, and those unexplained lights dancing overhead like faulty pixels in the render. It’s the kind of pattern that makes you sit up in the dim glow of your screen, connecting dots that the mainstream dismisses as coincidence.

    This isn’t some abstract theory pulled from late-night forums. It’s grounded in reports compiled by outlets like Strange Sounds, where the author frames it as the simulation glitching—beautifully, they say, but with an edge that cuts deep into our reality. We’re talking real-time breakdowns: power outages cascading from flooded substations, supply chains snapping under geological strain, and communication blackouts where the sky itself seems to interfere. If this is a simulation, it’s one that’s starting to show its seams, and those seams run right through the systems we rely on every day.

    Patterns in the Chaos: Why It Matters for the Grid

    Let’s break it down without the fluff. When multiple stressors hit at once—say, a solar flare messing with satellites while earthquakes disrupt underground cables—it’s not just bad luck. It’s a cascade that exposes how thin the veil is between stability and blackout. Power grids, those vast networks of wires and transformers, aren’t built for this level of overlap. One glitch leads to another: a storm knocks out primary lines, backup generators fail under ash from a distant eruption, and suddenly you’re in the dark, cut off from water pumps, fuel stations, and the digital threads that hold society together.

    I’ve tracked these patterns for years, from black-budget whispers to eyewitness accounts of aerial oddities. This cluster fits the mold of simulation theory, where our perceived world is a complex program hitting its limits. But forget the philosophy; the real hook is the risk. Infrastructure in critical sectors—transport, energy, comms—crumbles fast when anomalies stack up. And if you’re following these on social feeds or anomaly-tracking apps, remember: those platforms can glitch too, leaving you blind unless you’ve prepped your own setup.

    Fortifying Against the Glitch: Your Resilience Playbook

    Here’s where it gets practical. If the simulation’s fraying, don’t wait for the reset. Start with power: invest in solar backups or generators that can run independent of the grid. Stock water and food for at least a couple of weeks—think non-perishables, filtration systems, things that don’t need electricity to prepare. Communications? Go off-grid with ham radios or mesh networks that don’t rely on cell towers.

    On the data side, harden your edge. Use VPNs to mask your tracking of these events, switch to secure messengers for sharing intel with your circle, and keep offline copies of maps, survival guides, and anomaly databases. Centralized warnings might fail when the cascade hits, so build your own radar. This isn’t paranoia; it’s pattern recognition. We’ve seen it before in isolated incidents—now imagine them synced up. Your move is to decouple from the fragile center and stand firm on your own ground.

    Frequently Asked Questions

    Reports point to a mix: major quakes in stable zones, volcanic activity spiking, extreme weather blackouts, and unexplained aerial lights—all syncing up in a way that defies random chance, like code errors compounding.

    When disasters cluster, they overload grids—storms flood lines, quakes snap cables, anomalies disrupt signals. It’s a chain reaction that leaves infrastructure reeling, far beyond what single events cause.

    Secure backup power, like solar kits or fueled generators, and pair it with water storage. From there, layer in secure comms to track patterns without relying on failing networks.

    If you’re pulling intel from underground sources, disruptions can cut access. VPNs and offline archives ensure you stay informed, even when the digital grid glitches out.

  • Pentagon Quietly Raises America’s Cyber DEFCON: CMMC Enforcement Exposes Defense Supply Chain Weak Links

    Pentagon Quietly Raises America’s Cyber DEFCON: CMMC Enforcement Exposes Defense Supply Chain Weak Links

    Key Takeaways

    • The Pentagon’s enforcement of CMMC 2.0 via a new DFARS rule in 2025 elevates America’s cyber defense posture, mandating stricter cybersecurity for all defense contractors amid widespread noncompliance.
    • This shift exposes systemic vulnerabilities in the defense supply chain, particularly among smaller suppliers with outdated systems, potentially disrupting operations and revealing hidden weaknesses in black-budget programs.
    • Individuals and small businesses should mirror this heightened alert by adopting zero-trust practices, VPNs, and offline backups to safeguard against cascading cyber threats.

    Pentagon Quietly Raises America’s Cyber DEFCON: CMMC Enforcement Exposes Defense Supply Chain Weak Links

    Picture this: It’s the dead of night, and somewhere in the shadowed halls of the Pentagon, a switch flips. Not with fanfare or press releases, but through a quiet rule change in the Federal Register. On November 10, 2025, the Department of Defense rolled out enforcement of the Cybersecurity Maturity Model Certification (CMMC) 2.0, baked into DFARS clauses like 252.204-7021 and 7025. This isn’t just paperwork—it’s a de facto raise in our national cyber DEFCON level, forcing every contractor in the defense industrial base to prove their digital fortifications or get locked out of the game.

    We’ve tracked black-budget programs and unexplained aerial phenomena for years, piecing together patterns that the mainstream overlooks. But this move connects dots in a different shadow: the underbelly of America’s defense supply chain. Think about it—the same networks handling classified UAV tech or experimental propulsion systems are now under scrutiny. The Pentagon admits many contractors aren’t ready. Smaller suppliers, often the unsung links in the chain, run on exposed legacy systems, ripe for infiltration. One weak node, and the whole structure tremors.

    This enforcement isn’t coming out of nowhere. It’s a response to patterns we’ve seen building: state-sponsored hacks probing defense perimeters, supply-chain attacks that echo the SolarWinds breach. CMMC 2.0 demands zero-trust architectures, encrypted communications, rigorous access controls, and ironclad incident response plans. Offline backups? Mandatory. It’s like they’re bracing for an invisible war, one where the battlefield is code and the casualties are data breaches that could unmask sensitive operations.

    The Systemic Cracks in the Armor

    Let’s zoom in on the vulnerabilities. The defense industrial base isn’t a monolith—it’s a web of primes, subs, and tiny vendors. Many of these smaller players lack the resources for full compliance. Audits show gaps in basic hardening: unpatched software, weak multifactor authentication, networks wide open to the internet. The Pentagon’s own assessments reveal that noncompliance could sideline thousands of contracts, creating bottlenecks in everything from munitions to advanced sensors.

    For those of us watching black-budget edges, this raises flags. What happens when a noncompliant supplier tied to a classified program gets cut off? Disruptions could ripple into anomalous tech development—those unexplained sightings might tie back to interrupted R&D. And if adversaries exploit these weak links, we’re talking potential leaks of data that could rewrite what we know about hidden aerial programs.

    Patterns like this don’t emerge in isolation. We’ve seen similar escalations before: post-9/11 security ramps, the pivot to cyber after Stuxnet. This CMMC push feels like preparation for something bigger—a recognition that our cyber posture has been too lax, too trusting, in an era of persistent threats.

    Upgrading Your Own Cyber DEFCON

    If the Pentagon is locking down its ecosystem, it’s a signal for the rest of us. You, tracking these threads from your setup, know better than to ignore it. Start with the basics: Enable zero-trust on your devices—verify every access, every time. Use a solid VPN to mask your traffic, especially when digging into sensitive archives. Manage passwords with encrypted vaults, and rotate keys regularly.

    Harden your gear: Segment critical systems from the open web, keep offline backups of key data. Prepare for supply-chain fallout—if defense vendors falter, it could spike costs or delays in civilian tech. This isn’t paranoia; it’s pattern recognition. The same forces probing defense networks won’t stop at the gates.

    We’re in this together, peering into the unexplained. This cyber shift is another layer, another connection. Stay vigilant— the truth often hides in the code.

    Frequently Asked Questions

    CMMC 2.0 is the Pentagon’s framework for certifying cybersecurity maturity in defense contractors. Enforcement via DFARS rules in 2025 stems from mounting threats—it’s a quiet escalation to plug holes in the supply chain before they become entry points for bigger intrusions.

    Weak links in the defense supply chain could expose classified tech, including anomalous aerial projects. Noncompliance might disrupt R&D, creating patterns that echo in unexplained sightings or leaked data—we’re watching those connections closely.

    Mirror the Pentagon’s playbook: Adopt zero-trust verification, use VPNs for secure browsing, encrypt your data, and maintain offline backups. It’s about hardening your own perimeter against the same shadows targeting defense networks.

    Absolutely—many smaller contractors aren’t ready, which could lead to contract cutoffs and supply-chain snarls. Keep an eye on how this shakes out; it might reveal deeper vulnerabilities in hidden programs.