Category: Ancient Civilizations

  • January 18, 2026 Solar Storm: New Moon, No Trigger

    January 18, 2026 Solar Storm: New Moon, No Trigger

    Key Takeaways

    • New Moon occurred on 18 January 2026, as confirmed by sources like TheSkyLive and CHANI ephemerides.
    • Community trackers and NOAA observed heightened solar activity in early January 2026, with NOAA SWPC issuing G1–G2 watches for Jan 1–3 and community logs showing a K-index up to K=6 around Jan 10.
    • Independent commentator Stefan Burns flagged a ‘triple convergence’ involving planetary geometry, the New Moon, and a large sunspot complex, warning of an Earth-directed sunspot/CME around Jan 18; the core unresolved question is whether instrument records show an Earth-directed CME and a causal link to the planetary geometry claims.

    A Quiet Moon, A Loud Sun

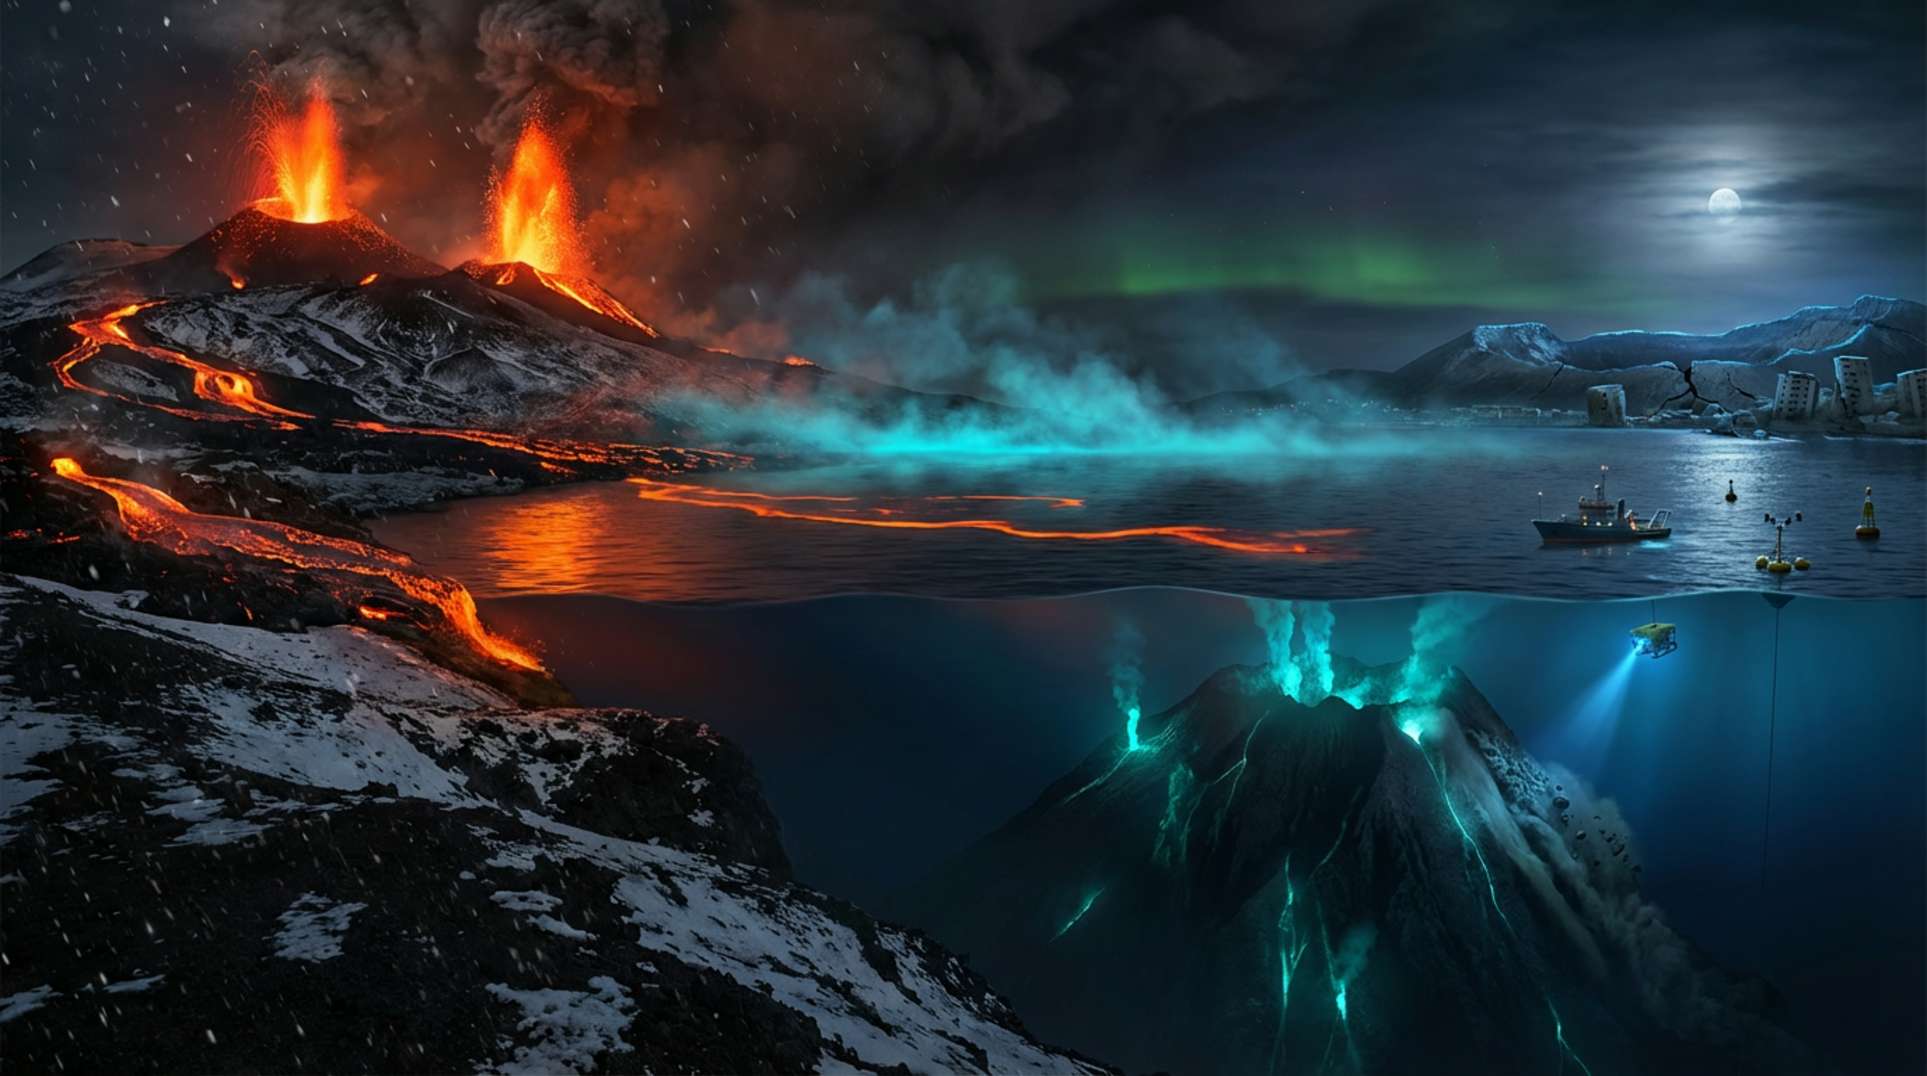
    The late-January skies in 2026 carried a weight of expectation. As the New Moon anchored the calendar on January 18, watchers turned their eyes upward, scanning for signs. Social feeds buzzed with updates, midnight vigils for aurora sightings stretched into the cold hours, and community groups lit up with reports that mixed excitement and an undercurrent of unease.

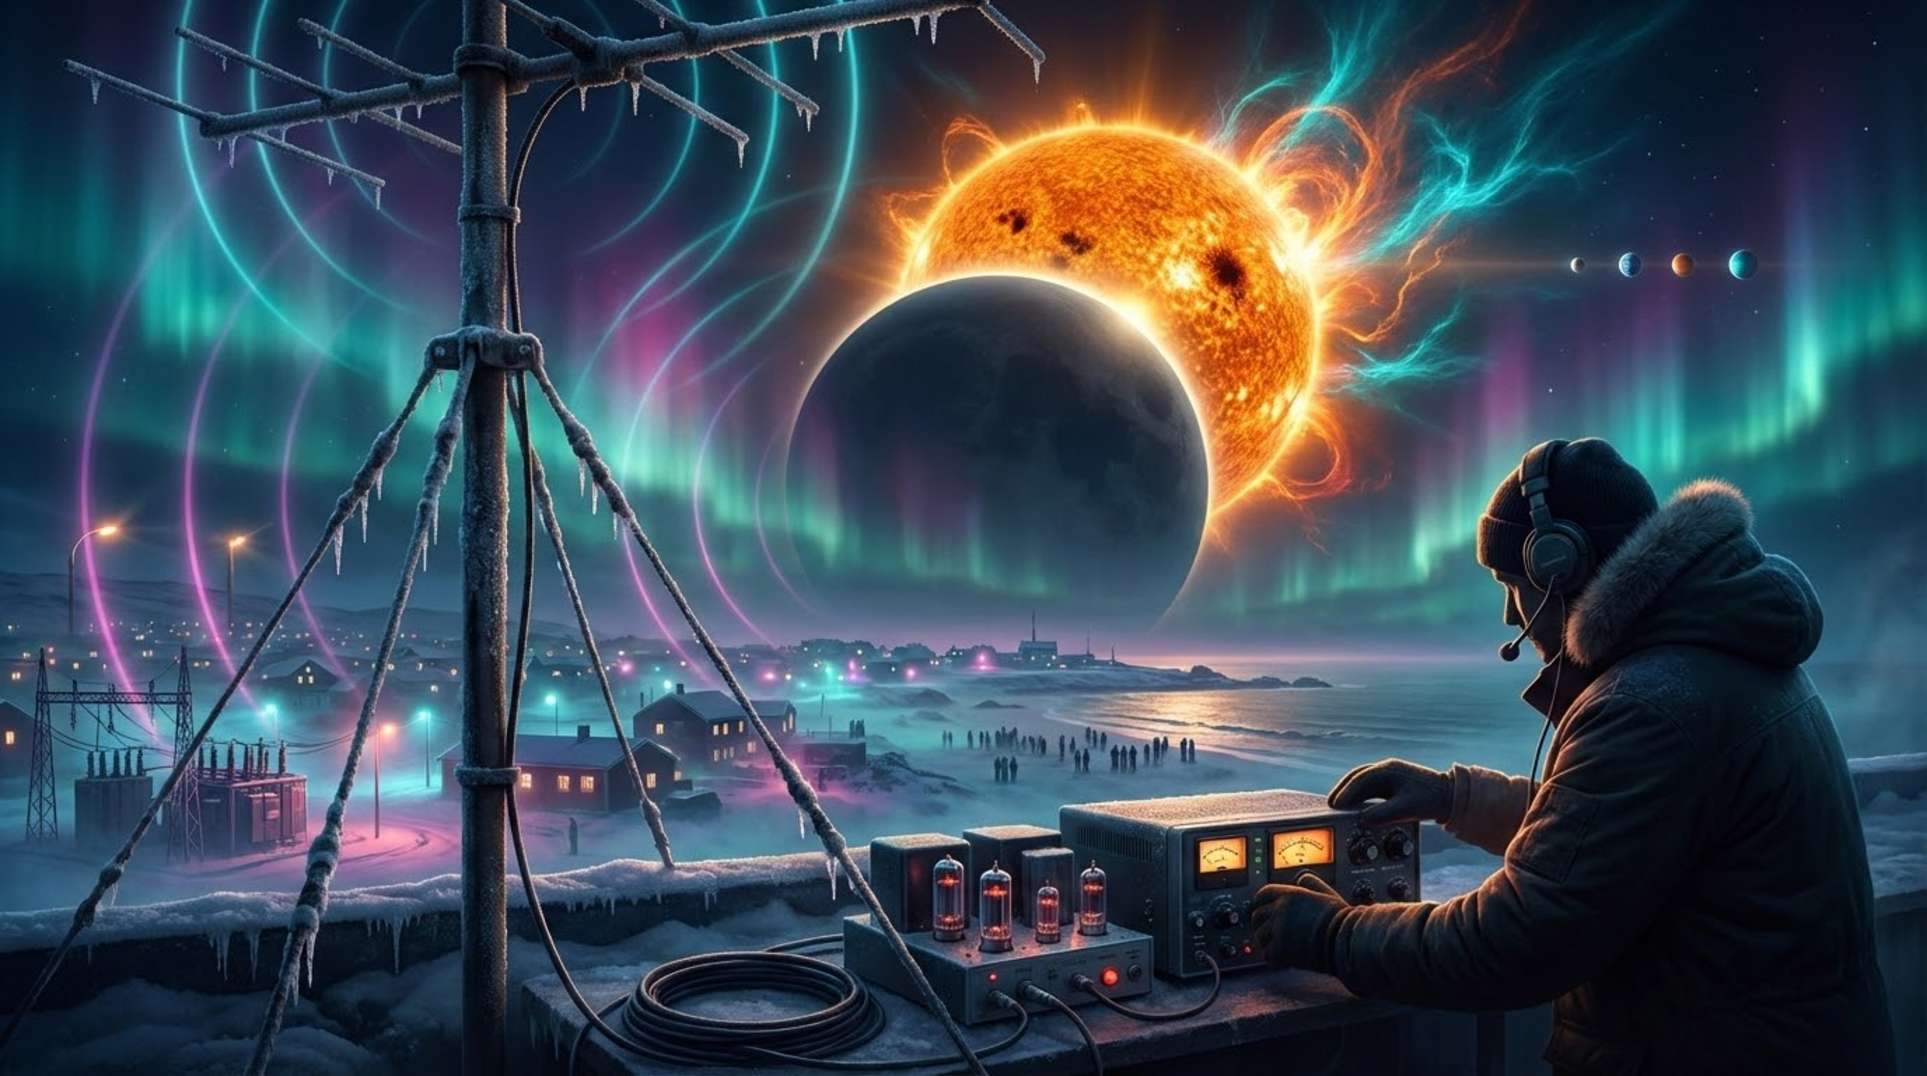
    Stefan Burns’ briefing on January 8 had set the stage, priming followers through his active channels to monitor the window around January 18, give or take two days. Reports poured in: aurora dancing in unexpected places, radio signals faltering, and personal accounts of shifting energies that left people restless.

    What Witnesses and Analysts Report

    In the words of those on the ground, this wasn’t just another solar uptick. Stefan Burns and his followers wove together solar imagery with terms like ‘Mercury cazimi’ and planetary conjunctions or oppositions, predicting amplified effects tied to the January 18 New Moon. They argued these alignments could stir the sun’s activity, leading to stronger impacts here on Earth.

    Amateur trackers on platforms like SpaceWeatherLive, SolarHam, and SolarMonitor shared timelines of sunspot growth, flare outbursts, and geomagnetic shifts throughout early January. Anecdotal logs from the community described aurora sightings that painted the skies, degradation in shortwave radio communications, and even subjective effects on health and energy levels—reports gathered from forums, not formal studies, but shared with conviction.

    Timelines, Tracks, and Hard Data

    Let’s pin this down with the instruments. The New Moon hit on January 18, 2026, per TheSkyLive and CHANI records. NOAA’s SWPC put out G1–G2 geomagnetic watches for January 1–3, and logs from SolarHam and SpaceWeatherLive captured a K-index spike to 6 around January 10.

    Active regions like AR 4336 and NOAA 13664 drew attention, tracked across solar rotations with forecasts highlighting their potential. Data streams tell the story: GOES X-ray flux for flares, SOHO/LASCO coronagraphs for CMEs, SDO imagery for sunspot details, and ACE/DSCOVR for solar wind and IMF readings. SWPC daily bulletins round it out.

    To match claims, check the SOHO/LASCO CME catalog for January 15–20; look for Earth-directed ejections timed to arrive near January 18, plus or minus two days.

    Date/Time (UTC) Event Active Region Data Source Earth-Directed?
    Jan 1–3, 2026 G1–G2 geomagnetic watches N/A NOAA SWPC N/A
    ~Jan 10, 2026 K-index up to 6 N/A SolarHam/SpaceWeatherLive N/A
    Early Jan 2026 Sunspot evolution/flares AR 4336/NOAA 13664 SDO/GOES To be verified via LASCO

    Official Story vs. What the Data Suggests

    Agencies like NOAA and NASA stick to magnetic complexity in active regions as the driver for flares and CMEs—reconnections sparked by internal solar forces, with watches issued based on X-ray fluxes, CME detections, and solar wind data.

    Mainstream views dismiss planetary alignments as triggers; no accepted mechanism links them to solar events, keeping it on the fringe. Yet both sides draw from the same tools: GOES, SOHO, SDO, ACE/DSCOVR. Where instruments log activity, community reports of aurora and radio glitches often sync up in timing.

    The split comes in interpretation—ideas like Mercury cazimi activating Pluto or Jupiter energies lack backing in standard models. To settle it, test for an Earth-directed CME around January 18 against the CME catalog and ACE/DSCOVR arrivals.

    Where the Evidence Stops and the Questions Start

    Correlation isn’t causation, and that’s the gap here. Did a CME from January 15–20 have the right speed and direction to hit Earth near the 18th? The SOHO/LASCO catalog and ACE/DSCOVR solar wind data hold the answers.

    Beyond tech disruptions like aurora or HF issues, claims of broader terrestrial effects—say, earthquake links—stay controversial, without routine acceptance in reviewed studies.

    For verification, pull SWPC bulletins from January 15–20, LASCO CME entries, GOES X-ray plots, and ACE/DSCOVR Bz and speed logs. Match them to reports. When sharing community anecdotes, flag them as such, and note if instruments back them or not.

    What It All Might Mean

    January 2026 brought real solar heat: NOAA watches, K-index jumps, and enduring active regions make flare and CME risks credible.

    But tying it to planetary alignments? Mainstream physics points to the sun’s own magnetic churn, not celestial geometry.

    Still, G-scale storms deliver aurora, radio blackouts, and threats to sats and grids—matching reports to data builds understanding, even if the alignment angle stays open. It keeps the dialogue alive between fringe patterns and hard facts, reminding us the sky holds more questions than answers.

    Frequently Asked Questions

    The New Moon occurred on that date, amid reports of heightened solar activity. Community observers noted aurora sightings, radio interference, and subjective energy shifts, tied to a proposed triple convergence by analyst Stefan Burns.

    Instrument records from SOHO/LASCO and ACE/DSCOVR need checking for CMEs launched January 15–20 with timing to arrive near January 18. Community reports align with geomagnetic disturbances, but causation to planetary geometry remains unproven.

    NOAA and NASA attribute solar events to internal magnetic processes, not alignments. Communities see potential links to planetary geometry, though both use the same data sources like GOES and SDO for observations.

    Verified effects include aurora and HF radio degradation during G-scale storms. Anecdotal health or energy reports from communities lack peer-reviewed support, and broader claims like geophysical triggering are controversial.

    It highlights patterns in solar activity that affect Earth, from tech disruptions to auroral displays. For trackers of anomalies, it bridges official data with alternative interpretations, sparking ongoing investigation.

  • Planetary Alignments: Can They Really Trigger Solar Flares?

    Planetary Alignments: Can They Really Trigger Solar Flares?

    Key Takeaways

    • A sequence of major solar eruptions, including an X5 flare on December 31, 2023, an X8.7 on May 14, 2024, and an X2.8 on May 27, 2024, has been recorded by NASA SDO/GOES and reported by monitoring outlets.
    • Operational forecasters like NOAA SWPC and NASA attribute these flares and CME impacts to solar magnetic processes, issuing watches and warnings based on observed CME properties such as size, speed, direction, and IMF—not planetary alignments.
    • An active research literature explores statistical correlations between planetary configurations, like Venus–Earth–Jupiter alignments, and solar activity; some correlations have been reported, but physical mechanisms remain debated, with planetary tidal forces far smaller than solar forces.

    Under a Strange Sky: The Night the Sun Roared

    The air hummed with anticipation that night. Aurora watchers far south of the usual zones stared up at shimmering lights dancing across the heavens, while HF radio operators cursed sudden dropouts that silenced their signals. Social media erupted with posts—videos capturing the glow, threads buzzing about a rare planetary alignment that seemed to ignite the chaos.

    Amateur reports poured in: stronger-than-usual auroras lighting up unexpected latitudes, temporary radio blackouts disrupting communications. Independent presenters jumped on the timing, linking it all to celestial bodies lining up just as the sun unleashed its fury.

    NASA’s SDO provided the timestamps—exact imagery of flare onsets, GOES classifications pinning down magnitudes like the X8.7 on May 14, 2024. Instruments lit up, skies transformed, and suddenly everyone was watching, wondering what force had stirred the sun to roar.

    What Witnesses and Independent Analysts Report

    In the forums and on YouTube, voices from our community cut through the noise. Take that video titled ‘Rare Planetary Alignment Just Triggered a Huge Solar Explosion’—it lays out the claim plainly: planets in line, sun explodes. Commenters pile on, sharing timelines where Venus, Earth, and Jupiter align, and solar spikes follow like clockwork.

    These narratives resonate because they echo patterns we’ve tracked for years. Witnesses describe auroras blazing brighter, radio signals vanishing at key moments. Independent analysts dig into historical data, pointing to date coincidences as proof—alignments matching flare peaks, forum threads compiling amateur logs to build the case.

    It’s not just hype; it’s people piecing together what they’ve seen with their own eyes and instruments. They argue these configurations aren’t random, that the sun responds in ways official channels overlook. We listen because we’ve been here before—spotting anomalies that demand a closer look.

    Timelines, Tracks, and Hard Data

    To ground this, let’s turn to the records. NOAA’s Space Weather Prediction Center (SWPC) stands as the official U.S. hub for forecasts, watches, and warnings on the G-scale. They draw from solar observations and in-situ monitors, accessible at https://www.swpc.noaa.gov/.

    NASA’s SDO and SVS offer time-stamped imagery and flare catalogs—think the X8.7 event on May 14, 2024, detailed on NASA SVS pages, or the X2.8 on May 27, 2024, covered in event reports. SWPC issues watches like G3 or G4 for incoming CMEs, triggered by observed departures and modeled arrivals.

    Forecasters zero in on CME details: size, speed, direction, magnetic-field orientation (IMF), and arrival uncertainties resolved by L1 monitors like ACE or DSCOVR. Here’s a quick table of key flares:

    Date Flare Class Source
    December 31, 2023 X5 News reports
    May 14, 2024 X8.7 NASA SDO/SVS
    May 27, 2024 X2.8 Watchers.news

    These entries make the chronology clear—pull the sources yourself and match them against alignment claims.

    Official Statements and Alternative Interpretations

    Agencies like NOAA SWPC and NASA stick to the script: flares and CMEs stem from solar magnetic reconnection, evolving fields within the sun itself. Their watches and warnings hinge on direct observations—in-situ data from monitors, not a glance at planetary positions.

    They don’t factor in alignments for forecasts; it’s all about those CME parameters and L1 confirmations to nail down arrivals. Yet, peer-reviewed papers and preprints tell another story—a 2022 Frontiers review, arXiv 2006.10694, a 2023 Solar Physics piece. Some spot statistical correlations, float ideas of resonance or synchronization.

    Here’s the rub: planetary tides are tiny, orders of magnitude weaker than the sun’s internal churn. Immediate triggering on short timescales? That’s contentious. Community views gain ground through pattern-spotting in datasets—persuasive coincidences, small studies facing bias critiques. Overlap might exist in long-term cycles, but the gap in mechanisms keeps the debate alive.

    Unanswered Questions and Where the Evidence Falls Short

    What if these alignments aren’t just coincidence? We need to ask: are the statistical links robust, or do they crumble under controls for bias and multiple testing?

    Then there’s mechanism—how could faint planetary pulls amplify to spark solar reconnection? Timescales don’t match: planets might nudge cycles over years, but individual flares in hours or days?

    Reproducibility matters—do associations hold across different catalogs and methods? And practically, if proven, would it shift forecasting at SWPC or NASA, or stay too vague for real use? These gaps keep us digging, eyes on the data.

    What It All Might Mean

    Boil it down: we’ve got documented X-class flares, timestamped by NASA SDO and GOES, with SWPC watches based on solid CME observations—size, speed, the works.

    The planetary-trigger idea sticks because of those eerie date matches, a niche literature backing correlations, and our instinct to connect dots, fueled by social shares. It’s easy to see why it pulls people in.

    Track this yourself—hit NOAA alerts, NASA SDO pages, peer reviews. Test claims with raw data: flare timings against ephemerides, CME lists. Journalists, demand quantitative checks, highlight uncertainties. The sun’s full of surprises; extraordinary links need ironclad evidence. Keep watching—the patterns might yet reveal more.

    Frequently Asked Questions

    A series of major solar flares and CMEs occurred, including X-class events on December 31, 2023, May 14, 2024, and May 27, 2024, leading to auroras visible far south and radio disruptions.

    These were captured by NASA SDO and GOES instruments, with timestamps and classifications available from official sources.

    Community reports and some studies note correlations between alignments like Venus-Earth-Jupiter and solar activity spikes, but physical mechanisms are debated due to weak tidal forces.

    Official agencies attribute flares to solar magnetic processes, not alignments, though research continues to explore possible links.

    NOAA SWPC and NASA use observed CME properties—size, speed, direction, and IMF—from solar imagery and in-situ monitors to issue watches and warnings.

    Planetary positions aren’t factored in; forecasts rely on direct data to predict impacts like auroras or radio issues.

    They stem from observed date coincidences, witness reports of auroras and disruptions, and statistical correlations in some research papers.

    Social media amplifies these patterns, resonating with those tracking anomalies, even as mechanisms remain unproven.

    Monitor NOAA SWPC for alerts and NASA SDO for flare imagery; compare with planetary ephemerides to test correlations yourself.

    Look for reproducible data and robust mechanisms in new studies to see if alignments hold up.

  • EMP Apocalypse: Why the ‘90% Die’ Claim Is Wrong

    EMP Apocalypse: Why the ‘90% Die’ Claim Is Wrong

    Key Takeaways

    • A nationwide electromagnetic pulse from a high-altitude nuclear detonation or severe geomagnetic storm could trigger catastrophic infrastructure failures, as warned by the bipartisan EMP Commission in 2004 and 2008, which recommended specific hardening measures for protection.
    • Verified evidence shows real vulnerabilities: events like the 1859 Carrington solar storm and the 1989 Quebec blackout disrupted power and communications, while long lead times for replacing large power transformers—often 36 months or more—could severely delay recovery, according to DOE and CISA reports.
    • Major questions linger: the EMP Commission’s unclassified reports don’t provide a single nationwide casualty figure, and the often-cited ‘90% fatality’ claim stems from testimony, advocacy, and fiction rather than official documents; debates continue on attack feasibility, precise damage patterns, and recovery timelines.

    A Midnight Without a Switch

    Imagine the clock strikes midnight, and the world flips off. Streetlights flicker out, plunging boulevards into shadow. Traffic signals go dark, cars grinding to a halt amid sudden confusion. In hospitals, monitors flatline as backup generators stutter under unexpected strain. Grocery stores lose their hum—refrigerators warming, shelves untouched in the blackout. Phones drop signals, ATMs refuse cards, and emergency lines echo silence. Fear creeps in, the kind that starts with a question: What’s happening? This isn’t just a local outage. It’s everywhere.

    History offers glimpses of how this could play out. The Carrington Event of 1859 sent sparks flying from telegraph lines, shocking operators and setting papers ablaze. In 1989, a geomagnetic storm hit Quebec, leaving six million in the dark for nine hours—transformers fried, power grid crippled. No verified national EMP attack has struck the U.S. yet. But these real events paint a picture of vulnerabilities that could turn a hypothetical pulse into widespread chaos.

    What Witnesses and Analysts Report

    Across forums and reports, voices from the community describe scenes that sound pulled from nightmares: a sudden blackout sweeping the nation, hospitals overwhelmed, food chains breaking down, communications severed. Witnesses in online threads and local meetups share stories of flickering lights and dead electronics, piecing together patterns that suggest something deliberate—or cosmic.

    Fiction has shaped much of this narrative. William R. Forstchen’s novel One Second After draws from EMP Commission materials, spinning tales of societal collapse with extreme casualty projections. Advocacy voices, including former commission members, echo this in testimony, labeling EMP threats as existential. These accounts gain traction, respected for highlighting risks mainstream outlets often overlook.

    Then there’s the viral surge: late 2024 and 2025 saw social posts and outlets like Hot1047 circulating AI-generated scenarios, claiming ‘90% fatalities’ or chatbot predictions without digging into sources. We treat these respectfully—they tap into real fears—but their origins matter. Grounded reports stick to natural events like geomagnetic storms or documented tests, such as the 1962 Starfish Prime nuclear explosion, which lit up Hawaiian skies and knocked out satellites. No recent deliberate HEMP attack on the U.S. has been confirmed.

    Timelines, Tracks, and Hard Data

    The trail starts with official documents. The EMP Commission’s 2004 Executive Report and 2008 follow-up on Critical National Infrastructures lay out the threats plainly, urging mitigation like grid hardening. They warn of cascading failures in power, water, and transport.

    History backs this up. The 1859 Carrington Event zapped telegraphs worldwide. On March 13, 1989, a geomagnetic storm blacked out Quebec for hours. Starfish Prime in 1962 showed nuclear HEMP effects on a smaller scale, damaging satellites and telecoms.

    Grid facts hit hard: large power transformers take about 36 months to replace, with industry reports citing 80–210 weeks due to manufacturing bottlenecks, per DOE and CISA. Mitigation costs? The 2008 report pegged selected protections at around $2 billion.

    NOAA uses the G-scale (G1–G5) and Kp index for storm warnings. As for that ‘90% die’ figure—it’s from testimony and books like Forstchen’s, not the Commission’s unclassified reports.

    Report Name Year Key Point
    EMP Commission Executive Report 2004 Warns of catastrophic EMP effects; recommends hardening infrastructure.
    EMP Commission Critical National Infrastructures 2008 Details vulnerabilities and mitigation costs around $2 billion.
    Carrington Event 1859 Disrupted telegraphs globally via geomagnetic storm.
    Quebec Blackout 1989 Geomagnetic storm caused 9-hour outage for 6 million.
    Starfish Prime 1962 Nuclear test produced EMP effects on satellites and telecoms.

    Official Story vs. What the Data Suggests

    Agencies paint a picture of managed risk. The EMP Commission, a congressional body, stresses that EMP or geomagnetic disturbances could devastate infrastructure, pushing for hardening without pinning down a nationwide death toll in unclassified docs. NOAA and NASA track space weather with G-scale forecasts, treating storms as predictable hazards based on events like 1989’s blackout.

    NERC, FERC, DOE, and CISA emphasize grid standards for geomagnetic risks, highlighting transformer supply chains as a weak link—long lead times could stretch recovery. Yet community narratives and advocacy push further, with former officials calling threats existential and floating high casualty estimates in hearings.

    Here’s the gap: those dire numbers often exceed the reports’ evidence. Open debates swirl around how many transformers would fail in a real scenario, whether a foreign actor could deliver a U.S.-wide HEMP undetected, and what recovery might actually look like. Data constrains the story, but rhetoric sometimes races ahead.

    What It All Might Mean

    The evidence points to real cracks in the system: the U.S. grid faces threats from HEMP or severe storms, and those long waits for transformers could turn outages into prolonged crises. We know interdependencies—with food, medicine, and transport—amplify the danger.

    But casualty figures? The ‘90% die’ claim traces back to testimony and stories, not a unified model in the Commission’s reports. It matters because even without doomsday stats, the risks are serious enough to act on—hardening grids, stocking spares, building microgrids—all feasible and cost-effective.

    For those tracking this, dig into primary sources: I can pull excerpts from the 2004 and 2008 reports on mitigations. At home, think Faraday cages for devices, offline backups, and generator plans—straight from DOE and CISA guides. When viral claims pop up, check dates, agencies, and originals before sharing. Mysteries remain on attacks, attribution, and fallout—worth watching, not assuming settled.

    Frequently Asked Questions

    No verified national EMP attack has occurred in the U.S. Historical examples are natural geomagnetic storms like the 1859 Carrington Event or the 1989 Quebec blackout, and tests like 1962’s Starfish Prime. The scenarios discussed are hypothetical, based on real vulnerabilities.

    The figure originates in testimony, advocacy statements, and fiction like William R. Forstchen’s novel One Second After, not from a single estimate in the EMP Commission’s unclassified reports. It’s been amplified in viral posts and AI-generated content, often without source details.

    Historical events like the Carrington storm and Quebec blackout show geomagnetic effects on power systems. The EMP Commission’s 2004 and 2008 reports detail risks, and DOE/CISA note long lead times for transformers—36 months or more—as a recovery hurdle.

    The EMP Commission recommends grid hardening, estimated at $2 billion for key measures. Practical steps include spare transformers, microgrids, and household protections like Faraday cages and generators, as outlined in DOE and CISA materials.

    Official sources like the EMP Commission warn of catastrophic potential without specific nationwide casualty numbers, focusing on mitigation. Community and advocacy voices often highlight extreme scenarios, sometimes drawing from fiction and testimony to emphasize existential threats.

  • Viral Underwater Pyramids: Mapping Data’s Dirty Secret

    Viral Underwater Pyramids: Mapping Data’s Dirty Secret

    Key Takeaways

    • Many viral “underwater structure” claims come from low-resolution public maps that can produce geometric illusions or interpolation artifacts rather than real constructions.
    • Modern multibeam surveys provide high-resolution, verifiable bathymetry, but as of Seabed 2030’s 2024 reporting only roughly 26.1% of the seafloor has been mapped to those standards—leaving large areas reliant on coarser satellite gravity data.
    • Some dramatic features discovered by multibeam (for example, tall seamounts) are genuine; other alleged structures lack multibeam or visual ground-truth and remain unresolved.

    A Silent Convoy Beneath the Dark Sea

    Vast stretches of the ocean floor remain poorly charted. When coarse grids are visualized with hillshading, they can suggest walls, pyramids, or other orderly shapes. Occasionally surveys reveal true surprises—seamounts and canyons that were previously unknown. The 2005 USS San Francisco collision with an uncharted seamount is a reminder that mapping gaps have real consequences.

    What Witnesses and Analysts Report

    Community researchers and content creators frequently post coordinates and annotated screenshots from public layers (GEBCO, ETOPO). These posts often mix data types and use visual shading that amplifies perceived geometry. Skeptics point to pareidolia and dataset artifacts; proponents push for follow-up surveys and ROV inspection. Both sides are limited by available data and funding for verification.

    Timelines, Tracks, and Hard Data

    Seabed 2030 coordinates a global effort to map the seafloor by decade’s end and reported about 26.1% coverage to modern multibeam standards in 2024. Large additions to the global grid occur when research vessels and institutions release multibeam surveys—the Schmidt Ocean Institute and national hydrographic offices regularly publish such data. In many regions, however, bathymetry is inferred from satellite gravity at resolutions on the order of kilometers, which can create interpolation artifacts not present in true sonar scans.

    Official Story vs. Community Interpretations

    Organizations like GEBCO and NOAA emphasize the difference between directly measured multibeam bathymetry and gravity-derived interpolations. Official archives and metadata can usually tell you whether a feature is supported by multibeam data or is gravity-inferred. Fact-checks frequently find that viral claims rely on the coarser layers; conversely, when multibeam is present it often reveals natural geological processes rather than artificial structures.

    What It All Might Mean

    Improving bathymetric coverage is important for navigation safety, scientific discovery, biodiversity assessment, and resource management. While many viral shapes prove to be artifacts, continued mapping will resolve outstanding cases—either confirming interesting geology or closing the book on false positives. Community-led reporting can help prioritize follow-up surveys when coordinates are accompanied by reliable metadata.

    How to Verify an Alleged Underwater Structure

    1. Collect the claimed coordinates and any original KMZ/KML or images cited by the claim.
    2. Check the underlying dataset and metadata (GEBCO, NOAA NCEI, national hydrographic offices, Seabed 2030). Determine whether the grid is multibeam-derived or gravity-inferred.
    3. Search for published multibeam surveys, expedition logs, or ROV/video evidence for that area.
    4. If only low-resolution gravity data is present, flag the claim as unverified and annotate likely artifacts (seams, interpolation, coarse shading).
    5. When multibeam supports a feature, seek photographic or sampling ground-truth; absent that, treat interpretations cautiously.
    6. For high-priority cases, contact data-holding institutions or Seabed 2030 to request follow-up, understanding that research-vessel time is limited and costly.

    FAQ

    What percentage of the seafloor is mapped to modern standards?
    Seabed 2030 reported roughly 26.1% coverage by modern multibeam surveys as of 2024; the remainder often relies on satellite gravity-derived models.
    Are viral underwater structures real?
    Some spectacular features shown by multibeam are real geological formations. Many viral claims, however, arise from low-resolution datasets that produce artifacts. Each claim must be checked against metadata and, ideally, multibeam or visual ground-truth.
    What was the USS San Francisco incident?
    On January 8, 2005, the USS San Francisco struck an uncharted seamount roughly 364 nautical miles southeast of Guam. The event underscores risks from incomplete bathymetric knowledge.
  • Nuclear Tests & Geomagnetic Storms: The Unproven Link

    Nuclear Tests & Geomagnetic Storms: The Unproven Link

    Key Takeaways

    • The strongest evidence points to geomagnetic storms being driven mainly by solar wind variations, coronal mass ejections, and high-speed solar wind streams, tracked through indices like Kp and Dst by agencies such as NOAA’s Space Weather Prediction Center.
    • Plausible alternative readings highlight discrete events like the Starfish Prime nuclear test on July 9, 1962, which injected artificial radiation belts, damaged satellites, and triggered visible auroras, yet these were human-made and not shown to alter Earth’s core geodynamo.
    • Crucial unresolved questions include whether multi-decadal rises in storm counts stem from actual solar activity or from biases in observation networks, and if 20th-century nuclear testing truly caused permanent changes to the planet’s deep magnetic field—links that remain unproven and require further scrutiny.

    A Silent Convoy Beneath the Dark Sky

    Imagine the night sky igniting without warning. Auroras dance where they shouldn’t, radios hiss with static, and instruments spike in ways that make the ground feel alive. Witnesses describe power glitches and an eerie hum, as if the planet itself is protesting. These moments pull communities together, sharing footage and plots online, linking them to space-weather alerts that feel too timely to ignore.

    Community voices like Stefan Burns highlight these spikes in Kp and Dst indices, tying them to local oddities—flickering lights, unexpected northern lights. History echoes this: during Starfish Prime, observers saw artificial auroras and blackouts, with satellite failures lingering for months, as noted in Spaceweather and National Geographic accounts.

    Agencies like NOAA’s SWPC offer near-real-time nowcasts and historical data, letting anyone cross-check those vivid auroras against official timelines. It’s this blend of personal experience and verifiable traces that makes the topic burn with urgency for those who’ve felt the disruptions firsthand.

    What Witnesses and Analysts Report

    Across social platforms and YouTube channels, independent researchers share magnetometer graphs blended with personal stories—unusual auroras, strange electromagnetic sensations that hit during storm peaks. Figures like Stefan Burns distribute these reports, building a picture of patterns that demand attention.

    Community claims often point to a rise in geomagnetic storm frequency through the 20th century, with intriguing overlaps between intense solar or geomagnetic events and major earthquakes. Many argue that nuclear testing reshaped Earth’s near-space environment, creating a legacy of instability.

    Yet within these circles, skeptical analysts push back, warning against mistaking correlation for cause. They call for rigorous statistical checks to separate genuine shifts from coincidental alignments, ensuring claims hold up under scrutiny.

    Timelines, Tracks, and Hard Data

    The Planetary Kp index, measuring global geomagnetic activity every three hours, stretches back to 1932, with archives maintained by NOAA’s SWPC and NCEI for easy downloads of Kp and Dst data. Peer-reviewed work ties storm patterns tightly to the 11-year solar cycle, though models of extremes draw from relatively short multi-decadal records, as seen in studies from Space Weather (Reyes et al., 2021) and Earth, Planets and Space (2020).

    Starfish Prime stands out: on July 9, 1962, this 1.4-megaton blast at about 400 km altitude injected roughly 10^29 energetic electrons, spawning artificial radiation belts that harmed satellites and sparked auroras, per NASA, OSTI, CTBTO, and National Geographic sources.

    For context, extreme Dst events include the -640 nT drop on March 13, 1989, a intense space-age storm, while the 1859 Carrington event is estimated at -1760 nT, hinting at broader historical scales. Nuclear testing tallied around 1,900 global detonations in the 20th century, with high-altitude blasts causing transient disturbances via EMP and ionospheric heating, as detailed in Glasstone & Dolan and GlobalSecurity reports.

    Metric/Event Details Date/Availability
    Kp/Dst Indices Global geomagnetic activity tracking Available from 1932 (Kp)
    Starfish Prime 1.4 megatons at ~400 km July 9, 1962
    Major Solar Storm Dst = -640 nT March 13, 1989
    Carrington Event Estimate Dst ≈ -1760 nT 1859

    Readers can extract Kp/Dst time-series from 1932 onward and plot storm counts against sunspot numbers to assess how 20th-century trends align with solar activity or observational shifts. This hands-on approach reveals overlaps and gaps that new analysis could fill.

    Official Story vs. What the Data Suggests

    According to NOAA’s SWPC, geomagnetic storms arise from solar wind, CMEs, and high-speed streams, quantified through Kp and Dst for infrastructure alerts—their standard position on the drivers behind these events.

    NASA and peer-reviewed papers confirm high-altitude tests like Starfish Prime temporarily reshaped near-Earth space, creating artificial belts and satellite issues, but they find no proof of impacts on the deep geodynamo in Earth’s core, as per NEPP and OSTI documents.

    Geomagnetism experts stress the patchy nature of pre-mid-20th-century data, suggesting apparent long-term increases might stem from better monitoring, index tweaks, or natural geomagnetic drifts rather than human interference.

    Community analysts, however, see mid-20th-century storm rises syncing with nuclear testing eras as potential evidence of lasting disruption—a view that hinges on teasing apart effects through quantitative methods. The gap lies in replicable stats that isolate anthropogenic marks from solar noise, leaving room for deeper probes.

    What It All Might Mean

    Solar activity clearly dominates geomagnetic storm patterns, with events like Starfish Prime delivering sharp, documented jolts to near-Earth space without enduring core changes.

    Still, uncertainties linger: how much do observational improvements skew 20th-century trends? Is there a solid tie between space weather and earthquakes? And have human actions touched the geodynamo? Current studies and defense reports see no such evidence.

    To advance, consider plotting Kp/Dst trends against sunspots, compiling bibliographies on man-made injections, or speaking with geomagnetism specialists about biases and nuclear fingerprints. This matters because it weaves personal stories with nuclear history, risks to grids and satellites, and scientific unknowns—demanding precise reporting to cut through the fog.

    Frequently Asked Questions

    Geomagnetic storms are mainly driven by solar wind variations, coronal mass ejections, and high-speed solar wind streams, as monitored by indices like Kp and Dst from NOAA’s SWPC.

    High-altitude tests such as Starfish Prime created temporary artificial radiation belts, damaged satellites, and caused auroras, but no established evidence shows they changed the deep geodynamo in Earth’s core, according to NASA and peer-reviewed literature.

    Community reports suggest rises linked to nuclear testing and patterns with earthquakes, but skeptics point to potential biases from improved observations and index changes, calling for statistical analysis to confirm any real trends beyond solar cycles.

    Access archives from NOAA’s SWPC and NCEI for Kp and Dst indices dating back to 1932, then plot storm counts against sunspot numbers to check alignments with solar activity or observational shifts.

    Storms can lead to power glitches, satellite failures, and infrastructure disruptions, as seen in historical events like Starfish Prime and major solar storms, highlighting vulnerabilities in grids and transportation.

  • Zodiac Z13 Cipher: Did AI Really Name Marvin Merrill?

    Zodiac Z13 Cipher: Did AI Really Name Marvin Merrill?

    Key Takeaways

    • Alex Baber, a self-taught codebreaker, says he solved the Zodiac Z13 cipher and that the plaintext reads a 13-letter name: \”Marvin Merrill\” (an alias tied to Marvin Margolis) — reported by the Los Angeles Times (Dec 23, 2025).
    • Baber reports using AI to generate and filter roughly 71 million 13-letter name candidates; some retired detectives have publicly said the circumstantial links merit investigation, but no major law-enforcement agency has validated the claim.
    • Open and critical questions remain: short ciphers like Z13 are prone to ambiguous solutions; independent cryptographers have not produced a public, reproducible verification; and non-cipher corroboration tying Marvin Margolis to Zodiac or the Black Dahlia has not been publicly confirmed.

    A Cold Case, an Online Video, and a Long Silence

    Shadows stretch across decades of unanswered questions. The Zodiac Killer struck in the late 1960s, claiming lives and mailing cryptic messages that haunted Northern California. Confirmed murders from 1968 to 1969 left five victims, with more suspected. Then there’s the Black Dahlia—Elizabeth Short, found mutilated in 1947, her case a magnet for endless theories.

    Enter the digital age. Armchair investigators pore over scans of old letters, trading leads in forums. That’s the world where Alex Baber’s claim surfaced. A YouTube video on Grant Warrington’s channel, titled \”Florida Man Solves Zodiac Killer Cold Case After 56 Years!\”, thrust it into view. Victims’ families wait, theories clash, and the silence from official channels grows heavier.

    What Witnesses and Analysts Report

    Alex Baber steps forward with a bold assertion. He claims the Z13 cipher reveals \”Marvin Merrill,\” an alias he connects to Marvin Margolis, as detailed in the LA Times. His method? AI crunching through about 71 million 13-letter name possibilities, narrowed by cryptanalytic steps, covered in the SF Chronicle.

    Baber shared his work with retired detectives and experts, including an NSA mathematician. Some former LAPD officers say the ties look worth probing. This fits a pattern—groups like The Case Breakers pushed Gary Francis Poste as Zodiac in 2021, stirring debate without closure.

    Online, reactions vary. Reddit threads and forums buzz with curiosity, but skepticism runs deep. Short ciphers invite multiple readings, and past claims have fizzled. Investigators in these communities weigh in thoughtfully, respecting the effort while questioning the fit.

    Timelines, Tracks, and Hard Data

    Let’s map the facts. Dates and sources anchor this story, cutting through the noise. Here’s a breakdown:

    Event or Claim Date Source
    Black Dahlia murder: Elizabeth Short found murdered January 1947 Well-documented historical fact
    Zodiac confirmed murders Primarily 1968–1969 (five confirmed victims; other suspected) Zodiac case summaries
    Z13 cipher mailed to San Francisco Chronicle April 1970 Zodiac case summaries
    Z340 cipher solved by David Oranchak, Sam Blake, and Jarl Van Eycke December 2020 Public reports
    The Case Breakers name Gary Francis Poste as Zodiac suspect October 2021 Public statements; law enforcement did not close the case
    Alex Baber’s claim: Z13 decrypts to ‘Marvin Merrill,’ linked to Marvin Margolis and Black Dahlia Reported December 23, 2025 LA Times
    Baber’s AI method (≈71 million names filtered); retired detectives support investigation 2025 coverage SF Chronicle and other outlets
    YouTube video amplification by Grant Warrington Recent (post-claim) Publicly available video
    FBI stance: Zodiac case remains open and unsolved Ongoing Public FBI statements

    These points stand firm. Amateur breakthroughs, like the Z340 solve, show what’s possible. But agencies hold the line—no validation for civilian IDs yet.

    Official Story vs. What the Data Suggests

    The FBI sticks to its script: Zodiac remains unsolved, open case. No nod to private claims. Local departments echo this, wary of loose connections—like Riverside’s stance on Cheri Jo Bates. They demand formal evidence, not forum buzz.

    Baber and backers push back. \”Marvin Merrill\” from Z13, AI-sifted, plus alleged Margolis links—they argue it’s enough for a fresh look. Cryptographers warn: short codes like this bend to many interpretations. Without stats or repeats, it’s shaky.

    Media splits the difference. LA Times and SF Chronicle report with caveats, while sensational pieces hype the drama. Real validation? That needs reproducible decryptions, expert checks, and hard ties—DNA, handwriting, alibis. Gaps yawn wide here.

    What It All Might Mean

    Boil it down: Baber’s claim hit major outlets, AI method drew eyes, and past amateur wins like Z340 lend weight. YouTube spread it far. Retired voices call for checks.

    Yet questions linger. Has any agency verified the decryption or Margolis links? Independent cryptos replicated it? Solid evidence beyond the cipher?

    Watch for submissions—DNA tests, case files. This probes how citizen sleuths, AI, and media reshape old cases. It matters because justice hangs in the balance, and we’re all piecing together the patterns.

    Frequently Asked Questions

    Alex Baber claims he decrypted the Zodiac Killer’s Z13 cipher, revealing the 13-letter name \”Marvin Merrill,\” which he links to an alias of Marvin Margolis. He ties this to both the Zodiac murders and the Black Dahlia case, as reported in the LA Times on December 23, 2025.

    Baber used AI to generate and filter approximately 71 million 13-letter name candidates, then applied cryptanalytic methods to narrow it down. He consulted retired detectives and experts, including an NSA mathematician, for review.

    The FBI maintains that the Zodiac case remains open and unsolved, with no validation of private-citizen identifications. Some retired LAPD detectives have publicly supported further investigation, but no major agency has confirmed the findings.

    Short ciphers like Z13 are prone to multiple plausible interpretations, making them ambiguous without strong corroborating evidence. Independent cryptographers have not yet provided public, reproducible verifications, and non-cipher links to Marvin Margolis remain unconfirmed.

    Yes, the Z340 cipher was solved in December 2020 by amateurs David Oranchak, Sam Blake, and Jarl Van Eycke. Groups like The Case Breakers also named suspects, such as Gary Francis Poste in 2021, but law enforcement did not close the case.

  • New Year’s Solar Flare: What NOAA Didn’t Explain

    New Year’s Solar Flare: What NOAA Didn’t Explain

    Key Takeaways

    • An M7.1 X-ray solar flare peaked around 13:51 UTC on December 31, 2025, from Active Region AR4324, as reported by NOAA SWPC and SpaceWeather.gov.
    • SWPC and partner agencies issued watches for elevated geomagnetic activity, predicting possible G1-G2 storms from January 1-3, 2026, with a potential G2 on January 3.
    • Community reports captured aurora and unusual skyglows at high latitudes, but CME arrival geometry and IMF Bz orientation leave questions about the storm’s true strength unresolved.

    A Quiet Night, a Loud Sun

    As the clock ticked toward midnight on New Year’s Eve 2025, eyes turned skyward. Fireworks lit the horizon, but in the forums and apps, alerts buzzed louder. Aurora hunters bundled against the biting cold, phones glowing with SWPC notifications, scanning for that ethereal green dance. Online threads ignited—posts pouring in from December 31 into January 3—as social feeds shared images of shimmering lights and odd skyglows at higher latitudes. The Sun had roared just hours earlier, at 13:51 UTC, and something felt off in the air, a subtle hum beneath the celebrations.

    What Witnesses and Analysts Report

    Aurora chasers in the community described vivid displays and strange skyglows lighting up the nights from December 31 to January 3, sharing photos on platforms like EarthSky and SpaceWeatherLive. One user on Reddit noted, “The lights were brighter than expected, with a weird pulsing—anyone else feel that?” Amateur radio operators tracked ionospheric disturbances, aligning with the SWPC watches, reporting static-filled bands and unexpected signal boosts. Independent analyst Stefan Burns, posting on his site and YouTube, tied the solar activity to planetary alignments, suggesting amplified energetic conditions that could ripple into geophysical effects. His newsletters draw followers, though some Reddit threads critique the blend of solid geophysics with bolder claims. Other voices in the forums weave in narratives of biological impacts, like unusual fatigue or heightened awareness, but these stay interpretive, distinct from the raw observations of lights and radio glitches.

    Timelines, Tracks, and Hard Data

    The event unfolded with precision in the records. Instruments captured the M7.1 X-ray flare from AR4324 peaking at 13:51 UTC on December 31, 2025, as detailed by NOAA SWPC and SpaceWeather.gov. Type II and Type IV radio emissions accompanied it, with the Type II shock speed estimated at about 893 km/s, per Watchers and SpaceWeatherLive. SWPC’s alerts forecasted possible G1-G2 geomagnetic activity from January 1-3, 2026, emphasizing a potential G2 on January 3. Australia’s BOM Space Weather Services echoed this, noting a possible glancing CME arrival in that window. Mainstream sources like EarthSky and Space.com highlighted aurora potential while stressing that IMF Bz orientation and CME geometry would dictate the outcome.

    Metric Details
    Flare Class/Time M7.1 at ~13:51 UTC, 31 Dec 2025
    Active Region AR4324
    Radio Emission & Shock Speed Type II/IV; ~893 km/s
    SWPC Watch Window Jan 1–3, 2026; possible G1–G2
    Predicted Aurora Reach High latitudes, per forecasts

    Official Story vs. What the Data Suggests

    NOAA SWPC lays it out straightforward: the M7.1 flare triggered a CME, with probabilistic forecasts hinging on direction, speed, and that critical IMF Bz orientation. Partners like Australia’s BOM ASWFC align, projecting a glancing blow from January 1-3, 2026. Where things split is in the interpretations. Community analysts point to layered effects—multiple CMEs, corotating interaction regions, fast wind streams—potentially stacking up for bigger impacts. They often fold in planetary alignments as amplifiers of energetic states, a view mainstream astrophysics dismisses as negligible for short-term solar tides. Both sides agree on the flare and CME basics, but the divergence hits on causation claims and broader effects, with uncertainties in arrival timing and interactions leaving room for debate.

    Where Instruments Stop and Anecdote Begins

    Several questions hang open. Will the CME deliver a direct hit or just a graze, and what about that IMF Bz on arrival? Interactions between multiple CMEs, CIRs, and wind streams could shift everything, demanding post-event modeling from spacecraft data. Then there’s the ground-level stuff: do reports of odd skyglows or sensory experiences match up with magnetometer spikes, HF radio blackouts, TEC shifts, or power grid hiccups? For follow-up, here’s a checklist: match eyewitness timestamps to local magnetometer logs and SWPC Kp indices; scour utility reports for any correlated incidents; pull in expert takes on planetary tidal influences and short-term solar effects. Testable claims like aurora timings or radio outages can be cross-checked against hard data, while speculative ones about consciousness or biological shifts need rigorous, matched datasets to hold water.

    What It All Might Mean

    At the core, we have a confirmed M7.1 flare on December 31, 2025, with Type II/IV radio bursts and a shock speed around 893 km/s signaling a CME in play. Forecasts point to likely geomagnetic boosts from January 1-3, 2026, bringing auroras to high latitudes, though Bz and trajectory will tell the full tale. Claims tying planetary alignments to solar flares or earthly effects remain unproven, needing solid evidence to bridge the gap. This matters because space weather hits us all—power grids, comms, even how we feel the cosmos. It shows how communities piece together patterns where official lines stop short. If you’ve got time-stamped photos, magnetometer data, radio logs, or location details, share them. Let’s build the picture together.

    Frequently Asked Questions

    An M7.1 X-ray solar flare peaked at around 13:51 UTC on December 31, 2025, from Active Region AR4324. It was accompanied by Type II and Type IV radio emissions, indicating a coronal mass ejection (CME) with an estimated shock speed of about 893 km/s.

    SWPC issued watches for possible G1-G2 geomagnetic activity from January 1-3, 2026, with community reports of auroras and skyglows at high latitudes. The final storm strength depends on CME geometry and IMF Bz orientation, which remain uncertain until arrival data is analyzed.

    Official sources like NOAA SWPC focus on the flare, CME, and probabilistic forecasts based on instrument data. Community and alternative analysts often link it to planetary alignments and broader energetic effects, though these interpretive claims lack mainstream empirical support.

    Witnesses described strange skyglows, auroras, and some sensory experiences like fatigue. Amateur radio groups noted ionospheric activity, but biological or consciousness-related claims are speculative and need corroboration from instrument logs.

    Share time-stamped photos, magnetometer or ionosonde logs, radio data, and precise location/time details. Correlating these with official records helps test claims against hard evidence.

  • Max Headroom TV Hijack: What Really Hit Chicago That Night

    Max Headroom TV Hijack: What Really Hit Chicago That Night

    Key Takeaways

    • On November 22, 1987, two Chicago TV stations—WGN-TV (Channel 9) and WTTW (Channel 11/PBS Chicago)—faced signal hijacks during evening broadcasts, disrupting normal programming with bizarre intrusions.
    • Verifiable evidence includes viewer-recorded tapes of the longer WTTW incident, FCC and FBI technical analyses with enhanced frames, and reports confirming a microwave link override as the likely method.
    • Unresolved questions linger: who orchestrated the hijacks, their exact methods and equipment, the geographic origin, and why no suspects were ever identified or charged despite investigations.

    A Night of Static and a Laughing Mask

    Picture Chicago on November 22, 1987. Families settle in for evening TV—news on WGN, sci-fi on PBS. The city hums under a cold autumn sky, VCRs whirring in living rooms. Then, at around 9:14 p.m., static tears through WGN’s newscast. A figure in a Max Headroom mask appears, audio garbled, backdrop spinning like corrugated metal. It’s brief, disorienting. Two hours later, during Doctor Who on WTTW, it happens again—longer this time, nearly 90 seconds of insults, crude gestures, and distortion. Viewers hit record, capturing the chaos. Engineers scramble, but the intrusion shakes faith in the broadcast system. What if your screen isn’t yours anymore?

    What Witnesses and Analysts Report

    Viewers who saw it live describe a masked performer mocking commercials, shouting obscenities, set against a rotating metal backdrop with warped audio. Station staff at WGN acted fast, killing the feed in 15 to 30 seconds. WTTW’s team struggled longer, allowing the extended Doctor Who hijack to play out and get taped by home recorders. Over the years, online communities—Reddit threads, podcasts, essays—have picked it apart. Some point to insider knowledge of station schedules; others speculate on a lone hacker with microwave gear. Researchers like Reddit user ‘bpoag’ have mapped potential transmission sites, drawing on geography and signal paths. These voices aren’t outliers; they’re dedicated analysts spotting patterns officials overlooked.

    Timelines, Tracks, and Hard Data

    The events unfolded precisely on November 22, 1987, hitting two stations in sequence. WGN’s intrusion struck during the 9:00 p.m. newscast at about 9:14 p.m., lasting 15 to 30 seconds. WTTW’s came later, around 11:15 to 11:20 p.m. amid Doctor Who, running roughly 90 seconds and preserved on multiple VCR tapes. The FCC’s Field Operations Bureau and FBI’s Chicago office led the probe, enhancing frames and analyzing forensics. Reports highlighted a microwave studio-to-transmitter link override—line-of-sight, high-power, tough to pull off in 1987. Surviving recordings from WTTW fueled the official work.

    Date Station Approx. Time Reported Duration Surviving Recordings Source
    November 22, 1987 WGN-TV (Channel 9) ~9:14 p.m. ~15–30 seconds None widely available Tribune reporting, FCC/FBI FOIA
    November 22, 1987 WTTW (Channel 11) ~11:15–11:20 p.m. ~90 seconds Multiple viewer VCR tapes WTTW reporting, FCC/FBI FOIA

    Official Story vs. What the Data Suggests

    Authorities from the FCC and FBI launched investigations, releasing FOIA documents with enhanced frames and notes on possible transmitter overrides. They stressed the technical hurdles—no easy feat without overpowering secure microwave links—and broadcasters echoed this, detailing how they regained control. No arrests followed, and no origin was publicly named. Yet researchers in radio enthusiast circles push back, arguing 1987 tech allowed savvy hobbyists to jury-rig equipment for such a stunt. Some theories invoke insider help or exploited vulnerabilities. Both sides nod to the microwave method as fitting the facts, but officials highlight improbability without proof of suspects, while enthusiasts see room for determined improvisation. The gap leaves space for doubt.

    What It All Might Mean

    We know two hijacks hit Chicago stations that night in 1987, with WTTW footage surviving and agencies conducting frame enhancements and forensics—yet no one faced charges. Questions persist: Where exactly did the signals originate? Who pulled it off, and for what reason—pure prank, a grudge, or a tech demo? Could hobbyists really assemble the gear back then? Are there sealed records still out there? This case endures because it exposes broadcast weak spots, tests trust in institutions, and fuels a tradition of media hacks. In a world of partial clues, communities build their own narratives. It reminds us to question secure systems and embrace the pull of unsolved puzzles—keep watching, keep analyzing.

    Frequently Asked Questions

    Yes, on November 22, 1987, two Chicago stations—WGN-TV and WTTW—experienced signal intrusions. Viewers reported and recorded the events, and official investigations by the FCC and FBI confirmed them through technical analysis and preserved tapes.

    Surviving VCR recordings of the WTTW hijack show the masked figure and distorted audio. FCC and FBI documents include enhanced frames and forensics pointing to a microwave link override, supported by station reports and community analyses.

    The FCC and FBI investigated, producing technical reports and attempting to trace the signal’s origin. Despite their efforts, including frame enhancements, no suspects were identified or charged, leaving the case unsolved.

    It highlights vulnerabilities in broadcast infrastructure and the challenges of attribution before modern forensics. The incident also reflects cultural interest in media pranks and how communities interpret incomplete data.

    No arrests were made, and the perpetrators remain unidentified. Investigations concluded without public attribution, fueling ongoing speculation among researchers.

  • Jack Parsons & Demons: Did Rockets Summon UAPs?

    Jack Parsons & Demons: Did Rockets Summon UAPs?

    Key Takeaways

    • Jack Parsons, a pioneer in American rocketry who co-founded Aerojet and contributed to JPL/Caltech projects, performed the Babalon Working rituals from January to March 1946, ending in tragedy with his death in a 1952 explosion—facts that anchor much of the lore surrounding occult influences in aerospace history.
    • Recent U.S. government reports, including the ODNI’s June 2021 preliminary assessment and AARO’s October 2023 consolidated report, frame UAP as issues of air safety and national security, documenting hundreds of incidents with many still unidentified, based on data from 2004 onward.
    • The ‘Collins Elite’ concept, alleging a Pentagon group seeing UAP through a demonic lens, stems from Nick Redfern’s 2010 book Final Events and related anecdotal accounts, but lacks confirmation in official DoD documents, remaining a disputed claim in UFO literature.

    A Desert Circle, a Test Stand, and the First Rocket Smoke

    Picture the Mojave Desert in late February 1946, under a vast, star-strewn sky. Jack Parsons, brilliant mind behind early rocket propulsion, stands in a ritual circle etched into the sand. He’s not alone—chants rise, invoking ancient forces in the Babalon Working, a series of ceremonies he’d begun in January. By day, Parsons pushes boundaries at the Jet Propulsion Laboratory, co-founding Aerojet and fueling America’s leap into space. But these nights blur lines between science and the arcane, sparking tales that his rituals might have torn open something unforeseen. Dismissed from key roles by the mid-1940s, his path ends explosively on June 17, 1952, in Pasadena—a blast that echoes through decades of speculation, linking occult experiments to unexplained skies without proving any direct cause.

    What Witnesses and Analysts Report

    Insiders and researchers in our community often point to a shadowy Pentagon faction, dubbed the ‘Collins Elite,’ who reportedly see UAP not as tech or threats, but as demonic entities straight out of biblical warnings. These claims surfaced prominently in Nick Redfern’s 2010 book Final Events, drawing from alleged interviews with former officials. From there, the narrative spread through podcasts, forums, and docs—witnesses describe internal debates where spiritual interpretations clashed with data-driven analysis, potentially stalling disclosure. Some tie this back to Parsons’ 1946 rituals, suggesting they coincided with early UFO waves, though that’s based on correlation and personal testimony rather than hard records. Anonymous accounts from program vets hint at religious frameworks shaping UAP views, but verifiable docs are thin, leaving these as respectful points of discussion among those tracking the patterns.

    Timelines, Tracks, and Hard Data

    Let’s ground this in what we can verify. Jack Parsons kicked off the Babalon Working in January 1946, with the final desert ritual often pegged to late February, wrapping by March. His rocketry creds are solid: co-founder of Aerojet, key player in JPL/Caltech efforts, though he faced dismissal in the mid-1940s. He died in that Pasadena explosion on June 17, 1952. On the government side, the ODNI’s Preliminary Assessment on Unidentified Aerial Phenomena hit on June 25, 2021, covering reports from November 2004 to March 2021. AARO’s consolidated FY23 report followed on October 25, 2023, with DoD noting hundreds of cases in review—many staying ‘unidentified’ due to odd movements or signatures. To sort facts from lore, here’s a quick table comparing timelines:

    Event/Source Date Scope/Key Details
    Parsons’ Babalon Working Jan–Mar 1946 (final ritual late Feb) Occult rituals by rocketry pioneer; death June 17, 1952
    ODNI Preliminary Assessment June 25, 2021 UAP data Nov 2004–Mar 2021; many unidentified cases
    AARO Consolidated Report Oct 25, 2023 Hundreds of incidents reviewed; fraction remain unexplained

    Official Story vs. What the Data Suggests

    Agencies like ODNI, DoD, and AARO stick to a straightforward line: UAP are about gaps in sensors, air risks, and security threats—no supernatural angles in their public docs. They emphasize data collection and analysis, with reports highlighting unresolved cases but steering clear of theology. Yet community researchers and witnesses push back, arguing that groups like the alleged ‘Collins Elite’—first detailed in Redfern’s work and echoed in anecdotes—frame these phenomena as demonic, possibly influencing what gets disclosed. Official records don’t back this as policy; it’s all testimonial, with no declassified memos confirming an organized faction. The hard data shines on incident counts and dates, but fades when it comes to proving theological policy inside the halls of power.

    What It All Might Mean

    We’ve got solid threads: Parsons’ rituals in early 1946 and his rocketry legacy, plus government reports logging unexplained UAP that defy easy labels. But questions linger—do declassified files link those ceremonies to specific sightings? Is there real proof of a ‘Collins Elite’ steering policy with spiritual motives, backed by memos or emails? To dig deeper, chase down archival records, verify named witnesses with service histories, and test community cases against official criteria for anomalies. This matters because it shows how beliefs, secrecy, and real mysteries collide, potentially framing disclosure in ways that go beyond science—touching on politics, faith, and procedure for all of us watching the skies.

    Frequently Asked Questions

    Jack Parsons co-founded Aerojet and worked on JPL/Caltech projects, pioneering American rocketry. He conducted the Babalon Working rituals from January to March 1946, with a final desert ritual in late February, and died in a 1952 explosion that fueled later myths.

    The ODNI’s 2021 assessment and AARO’s 2023 report treat UAP as air safety and security issues, covering hundreds of incidents from 2004 onward, with many remaining unidentified due to unusual data. They avoid supernatural explanations in public documents.

    The ‘Collins Elite’ idea originates in Nick Redfern’s 2010 book and anecdotal testimony, alleging a Pentagon faction viewing UAP as demonic. It lacks confirmation in official DoD reports, remaining disputed and based largely on secondhand accounts.

    Researchers link Parsons’ 1946 rituals to later UFO waves through correlation and interpretation, but these are anecdotal without direct causation proven. Official timelines focus on data-driven UAP analysis, leaving spiritual angles to witness narratives.

    Focus on declassified memos tying rituals to incidents, authenticated records of any ‘Collins Elite,’ and verifying witnesses with service details. Apply government criteria to anomalous cases to bridge official data and community interpretations.

  • Marsili Volcano: The Hidden Threat Beneath Etna & Naples

    Marsili Volcano: The Hidden Threat Beneath Etna & Naples

    Key Takeaways

    • Mt. Etna is undergoing intense paroxysmal activity at its summit craters, with lava fountains, ash plumes, and short lava flows observed; INGV reports and mainstream press confirm these events from 24–27 December 2025; the main unresolved risk centers on whether this signals a shift to more sustained or explosive behavior.
    • Campi Flegrei shows accelerating long-term unrest through ground uplift and increasing seismic swarms; peer-reviewed studies in Nature journals from 2024–2025, along with INGV bulletins, verify the intensification since 2021; the primary uncertainty is the potential for this bradyseism to culminate in an eruptive event.
    • Marsili, the largest submarine volcano in the Tyrrhenian Sea, exhibits ongoing hydrothermal and seismo-volcanic activity with evidence of flank instability; INGV data and Bulletin of Volcanology papers document its Holocene explosive deposits and dimensions (70 km × 30 km, summit at 450–508 m below sea level); the key unresolved risk is the possibility of a large flank collapse generating tsunamis, hampered by limited monitoring.

    A Silent Convoy Beneath the Dark Sea

    Imagine standing on the blackened slopes of Mt. Etna, ash falling like gritty snow under a rumbling sky, as lava fountains light up the night from the Northeast Crater and Voragine. It’s late December 2025, and the air carries the sharp tang of sulfur while tremors shake the ground. Shift your gaze westward across the Strait of Messina to the swollen caldera of Campi Flegrei, where the earth has been rising steadily since 2005, punctuated by seismic bursts that have grown more insistent since 2021. Now, drop your eyes to the sea between them—the calm, dark surface of the Tyrrhenian, hiding the massive form of Marsili below. No plumes rise here, no fountains erupt into view. Yet intermittent monitoring cruises by INGV have captured subtle signals: hydrothermal vents bubbling, seismic whispers, hints of unrest from a giant that remains mostly out of sight. Drone videos and ski-slope footage from Etna flood the news, republished by BBC and Washington Post, but Marsili offers no such spectacle—its story inferred from sparse data, a stark contrast to the visible fury onshore.

    What Witnesses and Analysts Report

    Eyewitness accounts from Etna’s December 2025 activity paint a vivid picture. Skiers on the slopes captured footage of lava fountains and ash plumes billowing from the summit craters, shared widely on social media and picked up by outlets like BBC, Washington Post, and VolcanoDiscovery. These firsthand videos show the raw power of the paroxysms, with glowing lava flows contrasting against the winter landscape. Turning to Marsili, local narratives circulating since 2010–2011 describe fears of catastrophic collapse and tsunamis, often drawing on early INGV warnings and amplified in media like a 2021 BBC feature. These stories reflect genuine community concern, portraying Marsili as a hidden threat capable of unleashing waves on nearby coasts. Independent voices, such as geophysics communicator Stefan Burns and various online analysts, argue that Marsili is under-studied and potentially more hazardous than acknowledged, sometimes weaving it into a larger narrative of Mediterranean unrest linking Etna and Campi Flegrei as signs of a regional awakening. On the other side, professional scientists and skeptics in online forums emphasize that while Marsili’s activity is real, claims of direct linkages or imminent disaster stretch beyond current evidence, treating these as interpretive leaps rather than confirmed observations.

    Timelines, Tracks, and Hard Data

    The record begins with Mt. Etna’s paroxysmal activity around 24–27 December 2025, involving summit craters like the Northeast Crater, with lava fountains, ash plumes, and short flows documented in INGV reports and covered by BBC and Washington Post. Campi Flegrei’s unrest traces back to accelerating uplift and seismicity since about 2005, with burst-like swarms intensifying from 2021 onward, as detailed in peer-reviewed papers in Nature Communications Earth & Environment (2024) and Nature Communications (2025), plus INGV bulletins. For Marsili, dimensions stand at approximately 70 km long by 30 km wide, with the summit at 450–508 meters below sea level and the base on a 3,400-meter plain, per INGV and VolcanoDiscovery. Geological evidence from Iezzi et al. in Gondwana Research (2013/2014) dates tephra layers to Holocene explosive submarine eruptions, a few thousand years before present. Monitoring by INGV and collaborators has logged persistent low-level seismo-volcanic signals, hydrothermal activity, and flank instability, though coverage relies on intermittent cruises rather than continuous setups. Tsunami modeling in Bulletin of Volcanology (2021) and related studies explores scenarios from large flank failures, but results hinge on variables like collapse volume, rate, and bathymetry, introducing significant uncertainties.

    Feature Value/Source
    Marsili Footprint ~70 km × 30 km (INGV; VolcanoDiscovery)
    Marsili Summit Depth ~450–508 m below sea level (INGV; VolcanoDiscovery)
    Marsili Tephra Age Range Holocene, a few thousand years BP (Iezzi et al., Gondwana Research 2013/2014)
    Etna Activity Date 24–27 December 2025 (INGV reports; BBC; Washington Post)
    Campi Flegrei Trend Accelerating uplift and seismicity since ~2005, intensification since ~2021 (Nature Communications Earth & Environment 2024; Nature Communications 2025; INGV)
    Monitoring Status Limited continuous coverage for Marsili (intermittent cruises, INGVs); robust for Etna and Campi Flegrei

    Official Story vs. What the Data Suggests

    INGV describes Marsili as the largest active submarine volcano in the Mediterranean, with its 70×30 km footprint, summit at 450–508 meters below sea level, and evidence of seismo-volcanic and hydrothermal activity plus flank instability—they stress the need for ongoing monitoring but avoid labeling it a ‘supervolcano’ in the traditional sense. Peer-reviewed work, including Iezzi et al. and Bulletin of Volcanology studies, acknowledges the Holocene explosive record and models potential tsunamis from flank collapses, yet highlights uncertainties in collapse scale and dynamics. In contrast, community interpretations and local media often portray Marsili as a supervolcano on the brink, connecting it to Etna’s December 2025 paroxysms and Campi Flegrei’s swarms in a unified crisis narrative that outpaces the evidence. A critical gap persists: no strong geophysical data establishes a short-term causal chain between these sites, with literature viewing them as regionally related but not proven triggers. Official positions call for caution, research, and preparation, which aligns with public concerns without endorsing the more dramatic claims.

    What It All Might Mean

    Marsili stands as a massive, active submarine volcano with confirmed Holocene explosive deposits, ongoing seismic and hydrothermal signals, and flank instability—meanwhile, Etna’s late-December 2025 activity and Campi Flegrei’s escalating unrest demand attention on their own merits, backed by INGV data and peer-reviewed analyses. Open questions loom large: does Marsili truly qualify as a supervolcano by metrics like magma volume or VEI, and what are the real odds of a rapid flank collapse producing tsunamis? For residents and planners, this underscores the value of enhanced ocean-bottom monitoring through seismometers, hydrophones, and repeat surveys, alongside transparent communication that addresses fears without exaggeration. Researchers should prioritize data on tephra volumes from Iezzi et al., modeled collapse scenarios, and Campi Flegrei uplift patterns to pinpoint monitoring gaps. In the end, the worry is understandable—these volcanoes remind us of forces beyond daily view—but the science points to vigilance over panic, leaving room for discoveries that could reshape the picture.

    Frequently Asked Questions

    Mt. Etna experienced marked paroxysmal activity from its summit craters, including lava fountains, ash plumes, and short lava flows between 24–27 December 2025. This was documented by INGV reports, eyewitness footage from skiers and drones, and republished by mainstream outlets like BBC and Washington Post.

    INGV and peer-reviewed sources do not classify Marsili as a supervolcano in the strict sense, despite its large size and Holocene explosive history. Community narratives sometimes use the term, but official descriptions emphasize its activity and instability without endorsing that label.

    While these sites are regionally related in the Mediterranean volcanic arc, no robust geophysical data shows a short-term causal link between Etna’s 2025 activity, Campi Flegrei’s unrest, and Marsili’s signals. Independent analysts suggest broader patterns, but professionals note the absence of proven contemporaneous triggers.

    Monitoring relies on intermittent cruises and deployments by INGV and collaborators, capturing seismo-volcanic signals, hydrothermal activity, and flank instability. This is less comprehensive than onshore systems for Etna and Campi Flegrei, highlighting a gap in continuous ocean-bottom coverage.

    Peer-reviewed models indicate that a large flank collapse could generate tsunamis, but outcomes depend on variables like volume and speed, introducing high uncertainty. Official recommendations focus on improved monitoring and preparation rather than predicting imminent events.